Bangladesh · PM₂.₅ Air Pollution · 2000–2023
Air that Chokes
a Nation
A 24-year story of relentless pollution rise
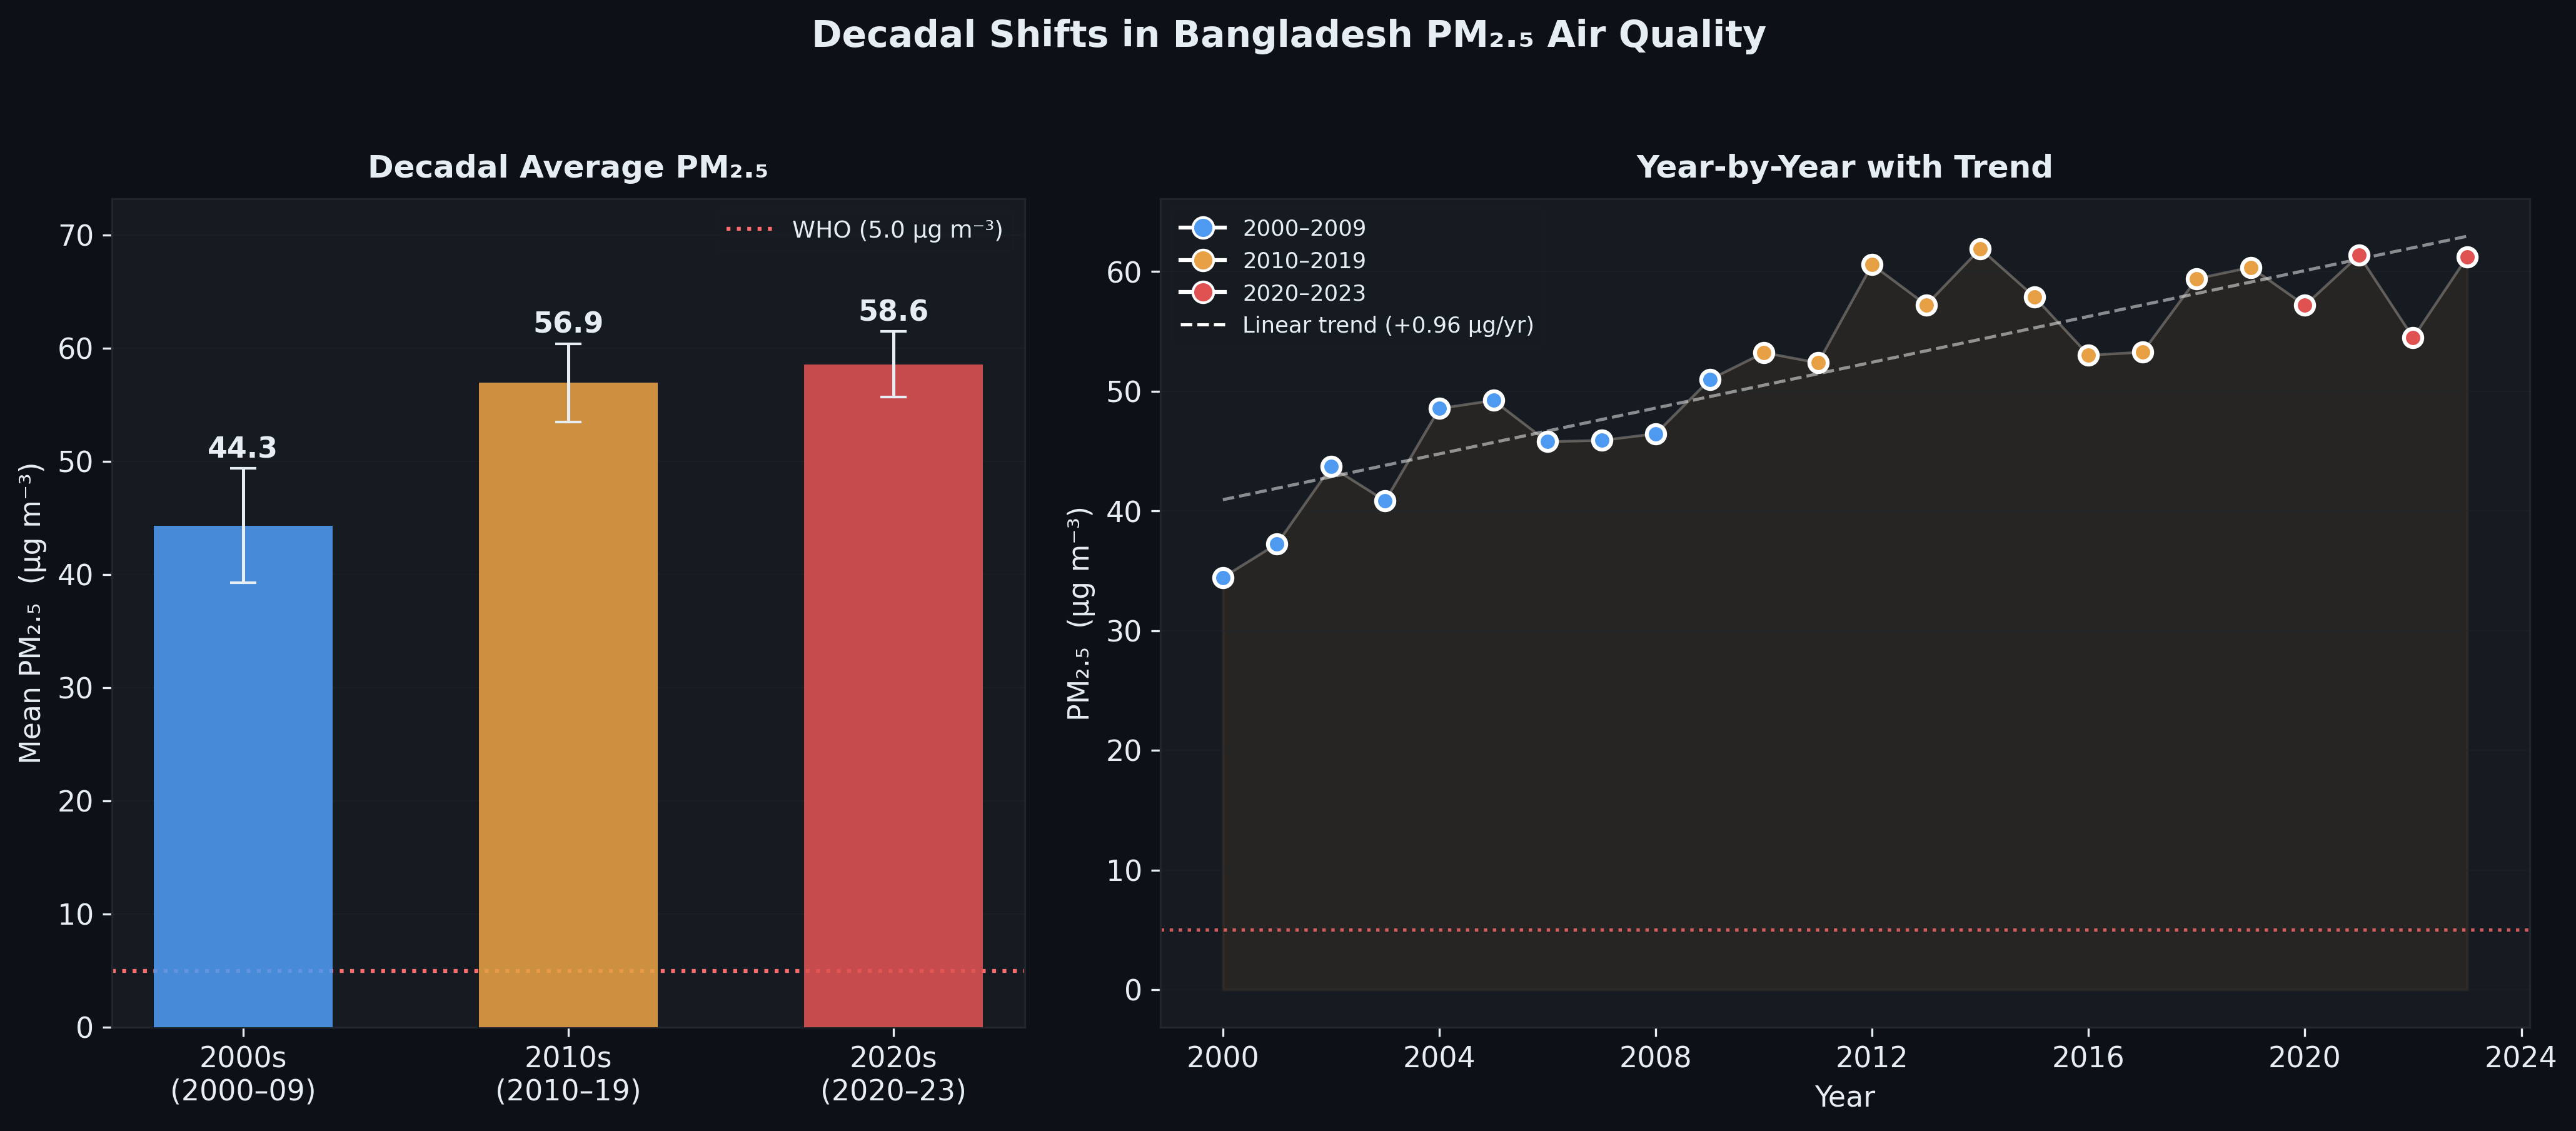
From 34.4 µg m⁻³ in 2000 to 61.2 µg m⁻³ in 2023 — Bangladesh's fine particulate matter has nearly doubled over two decades, placing every citizen in chronic exposure to air more than 12× the WHO safe limit.
78%
Increase 2000→2023
12×
Above WHO Guideline
+0.96
µg m⁻³ per year trend
8/8
Divisions above safe limit
Chapter 01
The Long Upward Climb
Bangladesh's national annual mean PM₂.₅ has followed a persistent upward trajectory since 2000 — driven by rapid urbanisation, industrial growth, brick kilns, and transboundary dust. Despite year-to-year variability, the 5-year rolling mean leaves no ambiguity: the air is getting worse.
⚠️
WHO Air Quality Guideline: 5.0 µg m⁻³
Every single year from 2000 to 2023, Bangladesh's national mean PM₂.₅ has exceeded the WHO annual guideline. In 2023, the national average of 61.2 µg m⁻³ is 12.2 times the safe threshold — and has never come close to it in the 24-year record.
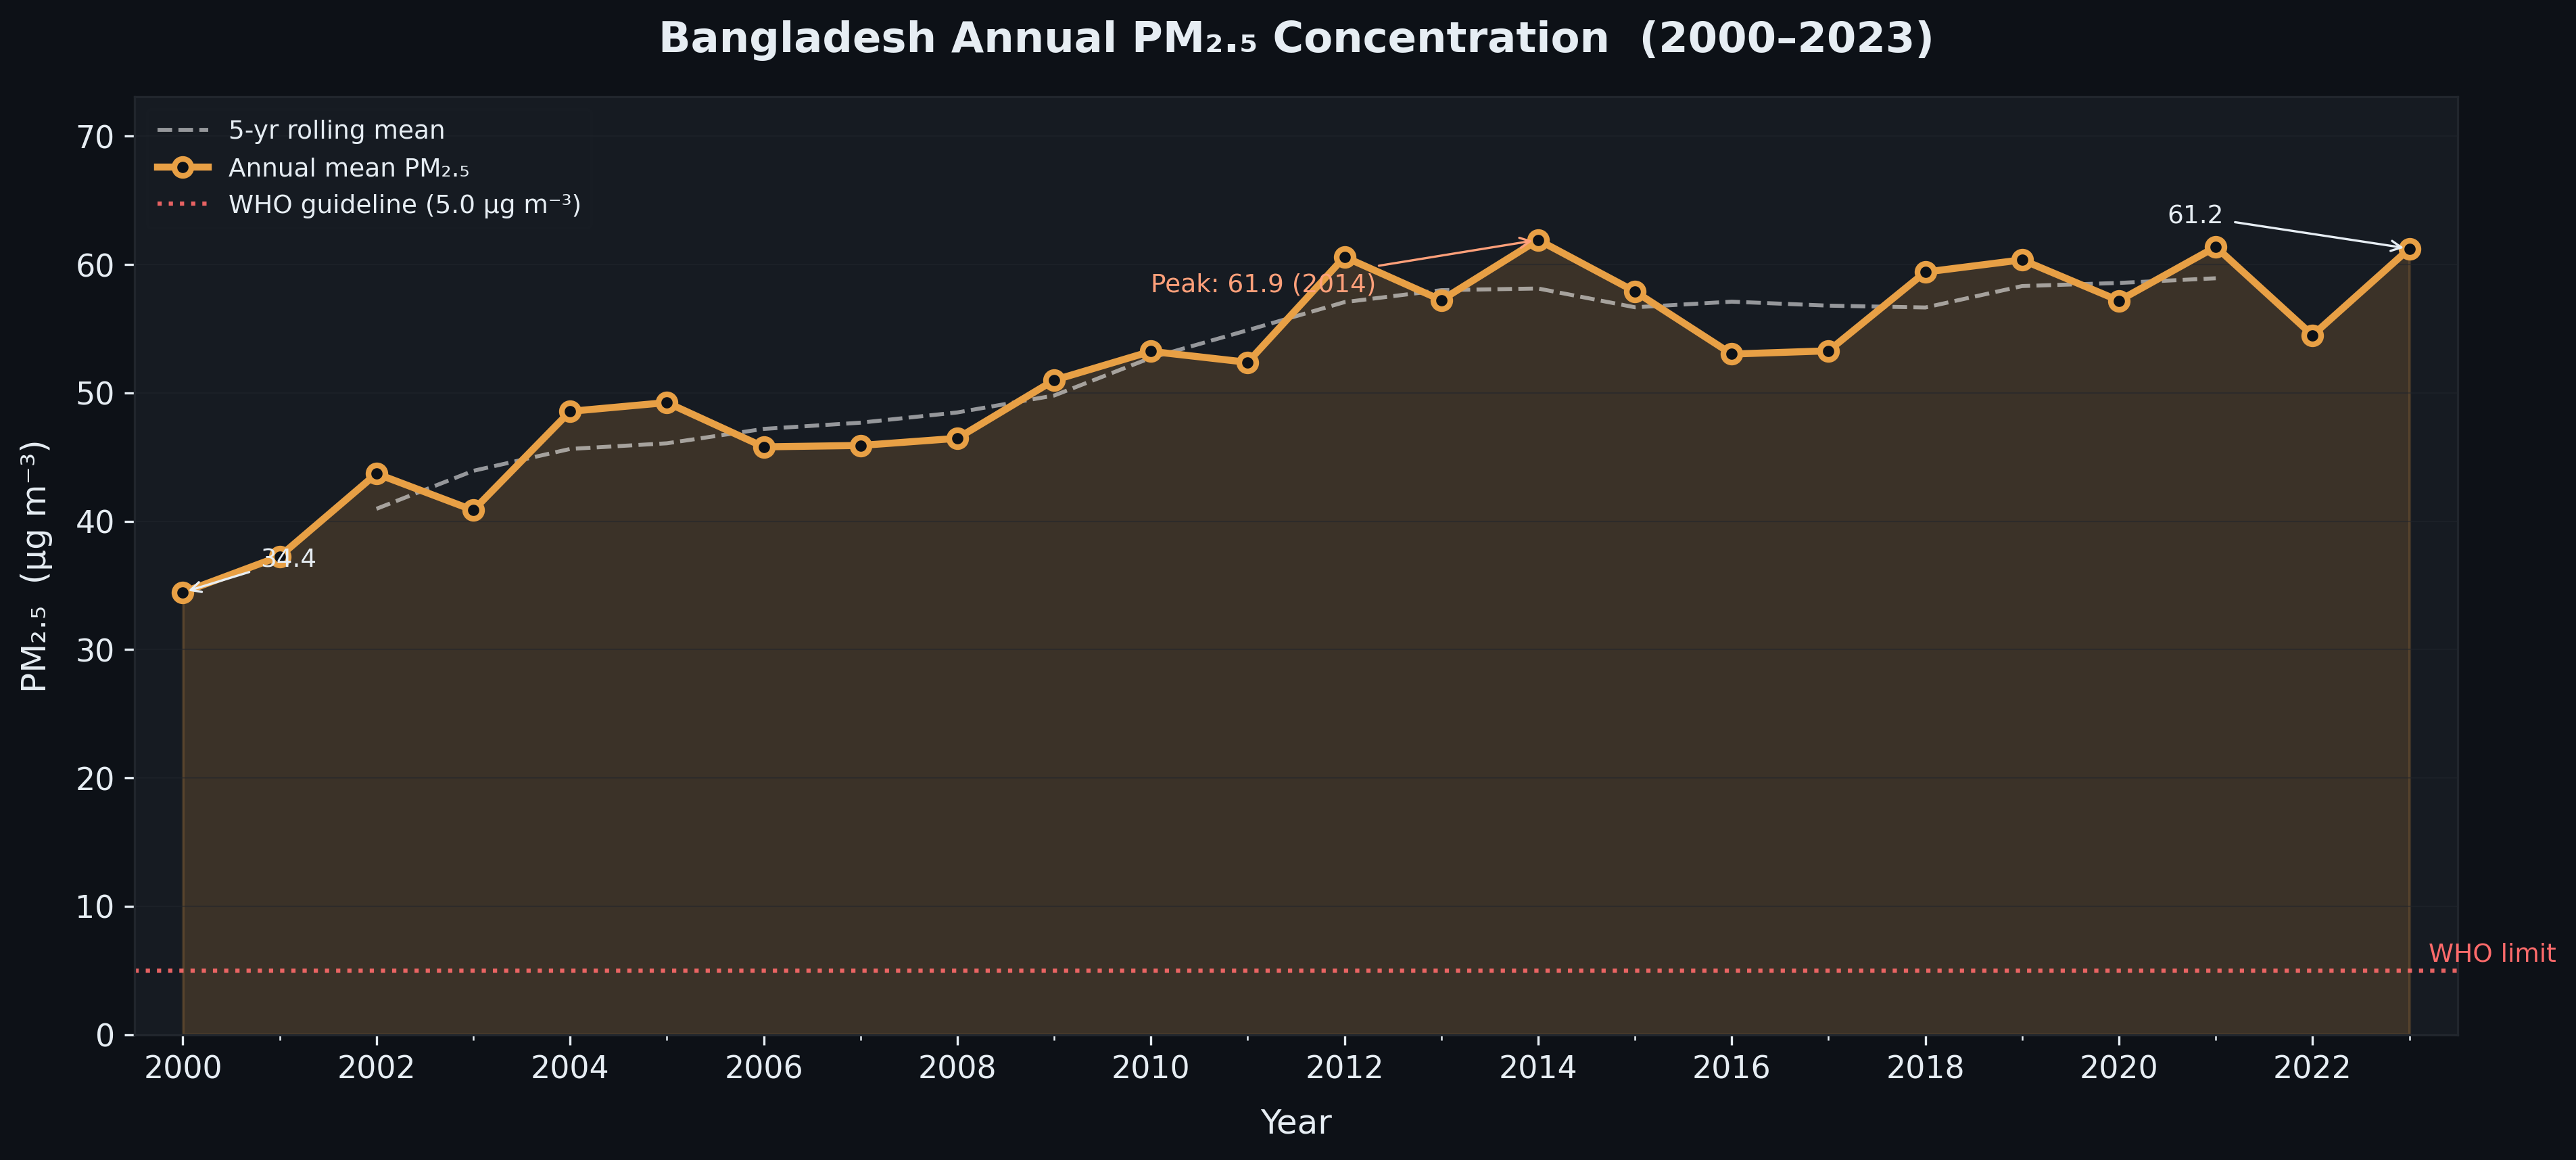
01 · Bangladesh Annual Mean PM₂.₅ Concentration (2000–2023) with 5-yr rolling mean and WHO guideline
📈
+78%
Total increase
From 34.4 µg m⁻³ in 2000 to 61.2 µg m⁻³ in 2023 — a rise of 26.8 µg m⁻³ over two decades.
⛰️
61.9
Peak year: 2014 (µg m⁻³)
2014 marked the worst year on record. A brief respite in 2015–2017 was followed by renewed increases, with 2023 nearly matching the peak.
📉
+0.96
µg m⁻³ per year (linear trend)
The underlying linear trend of nearly 1 µg m⁻³ per year persists regardless of inter-annual fluctuation — a structural, not cyclical, problem.
🔄
2020
COVID-19 dip year
2020 shows a modest dip to 57.2 µg m⁻³, likely reflecting reduced industrial and transport activity during the pandemic — but pollution rebounded sharply in 2021.
2000 · Baseline
The Starting Point
National mean of 34.4 µg m⁻³. Already 6.9× the WHO limit — but this would prove to be the cleanest air Bangladesh would know in this century.
2002 · First Spike
Early Surge
PM₂.₅ jumps to 43.7 µg m⁻³ — a 27% rise in two years. Rapid brick kiln expansion and construction boom are key contributors.
2009–2012 · Acceleration
Industrial Expansion Era
Sustained increases push pollution from ~45 to over 60 µg m⁻³. The 2010s mark a structural shift upward — pollution consolidates at a new, higher baseline.
2014 · Peak
Record High: 61.9 µg m⁻³
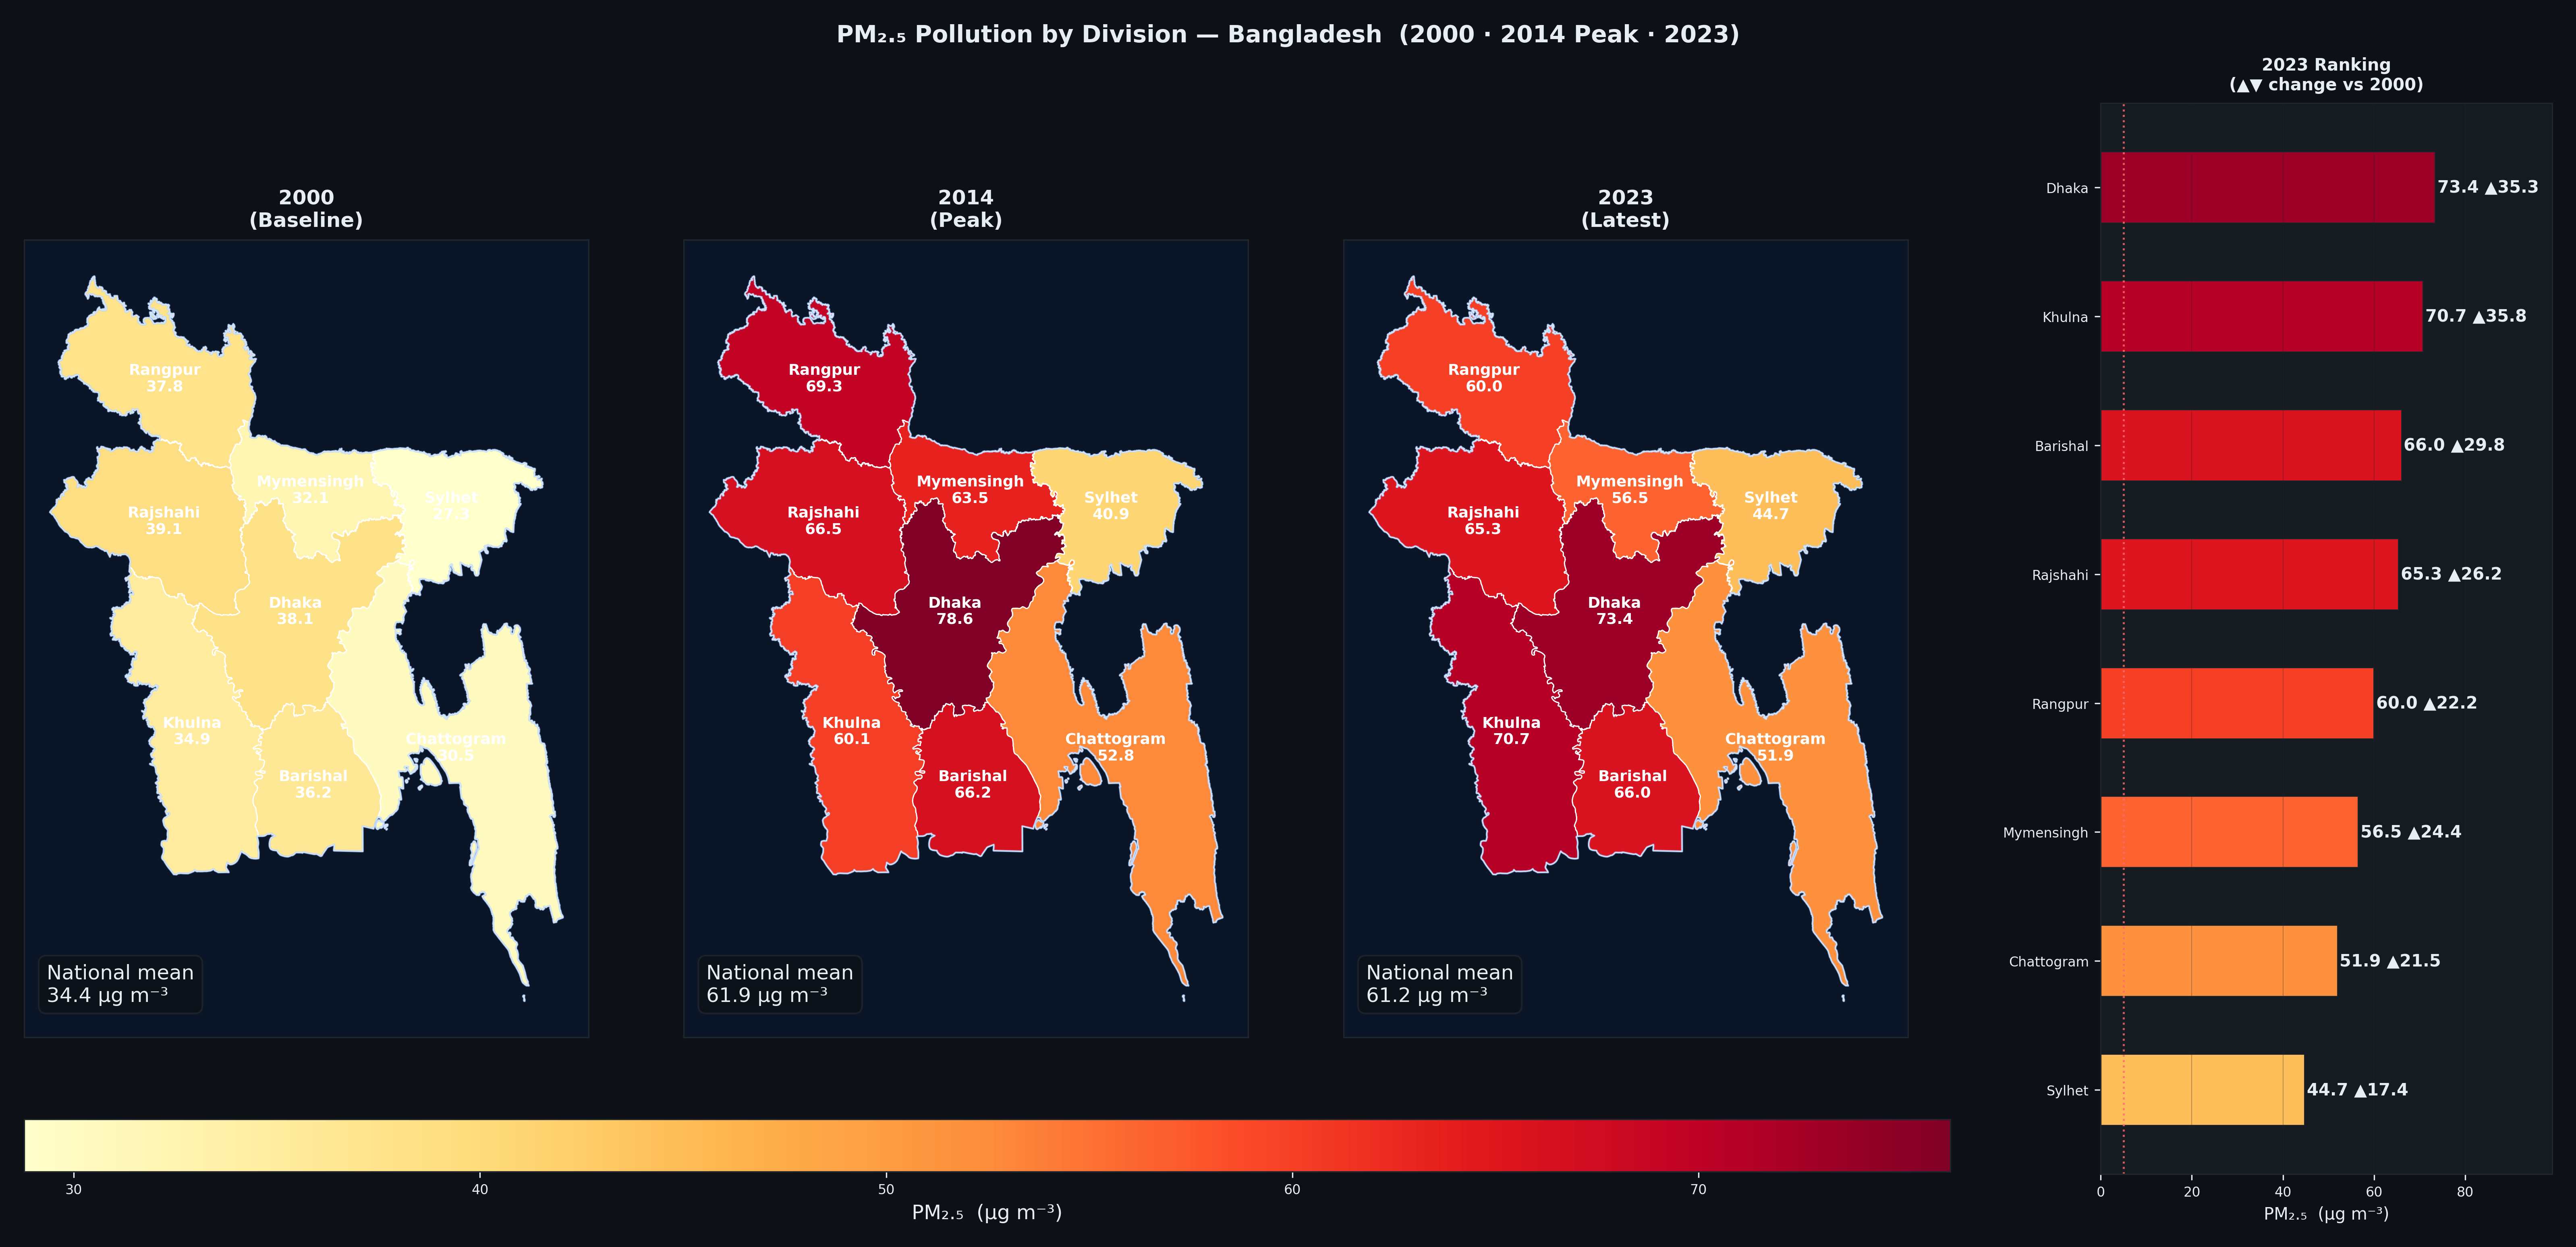
The worst year in the record. Dhaka division reaches 78.6 µg m⁻³. Coincides with peak construction and energy generation from fossil-fuel-heavy sources.
2020–2023 · Plateau of Crisis
No Recovery in Sight
Post-COVID, pollution rebounds immediately. 2023 closes at 61.2 µg m⁻³ — essentially matching the 2014 peak and confirming that the air quality crisis has deepened permanently into the decade.
Chapter 02
The Geography of Pollution
Pollution has not spread uniformly. The spatial maps reveal a dramatic story: what began as isolated hotspots in 2000 has engulfed almost the entire country by 2023, with the north-central regions bearing the greatest burden.
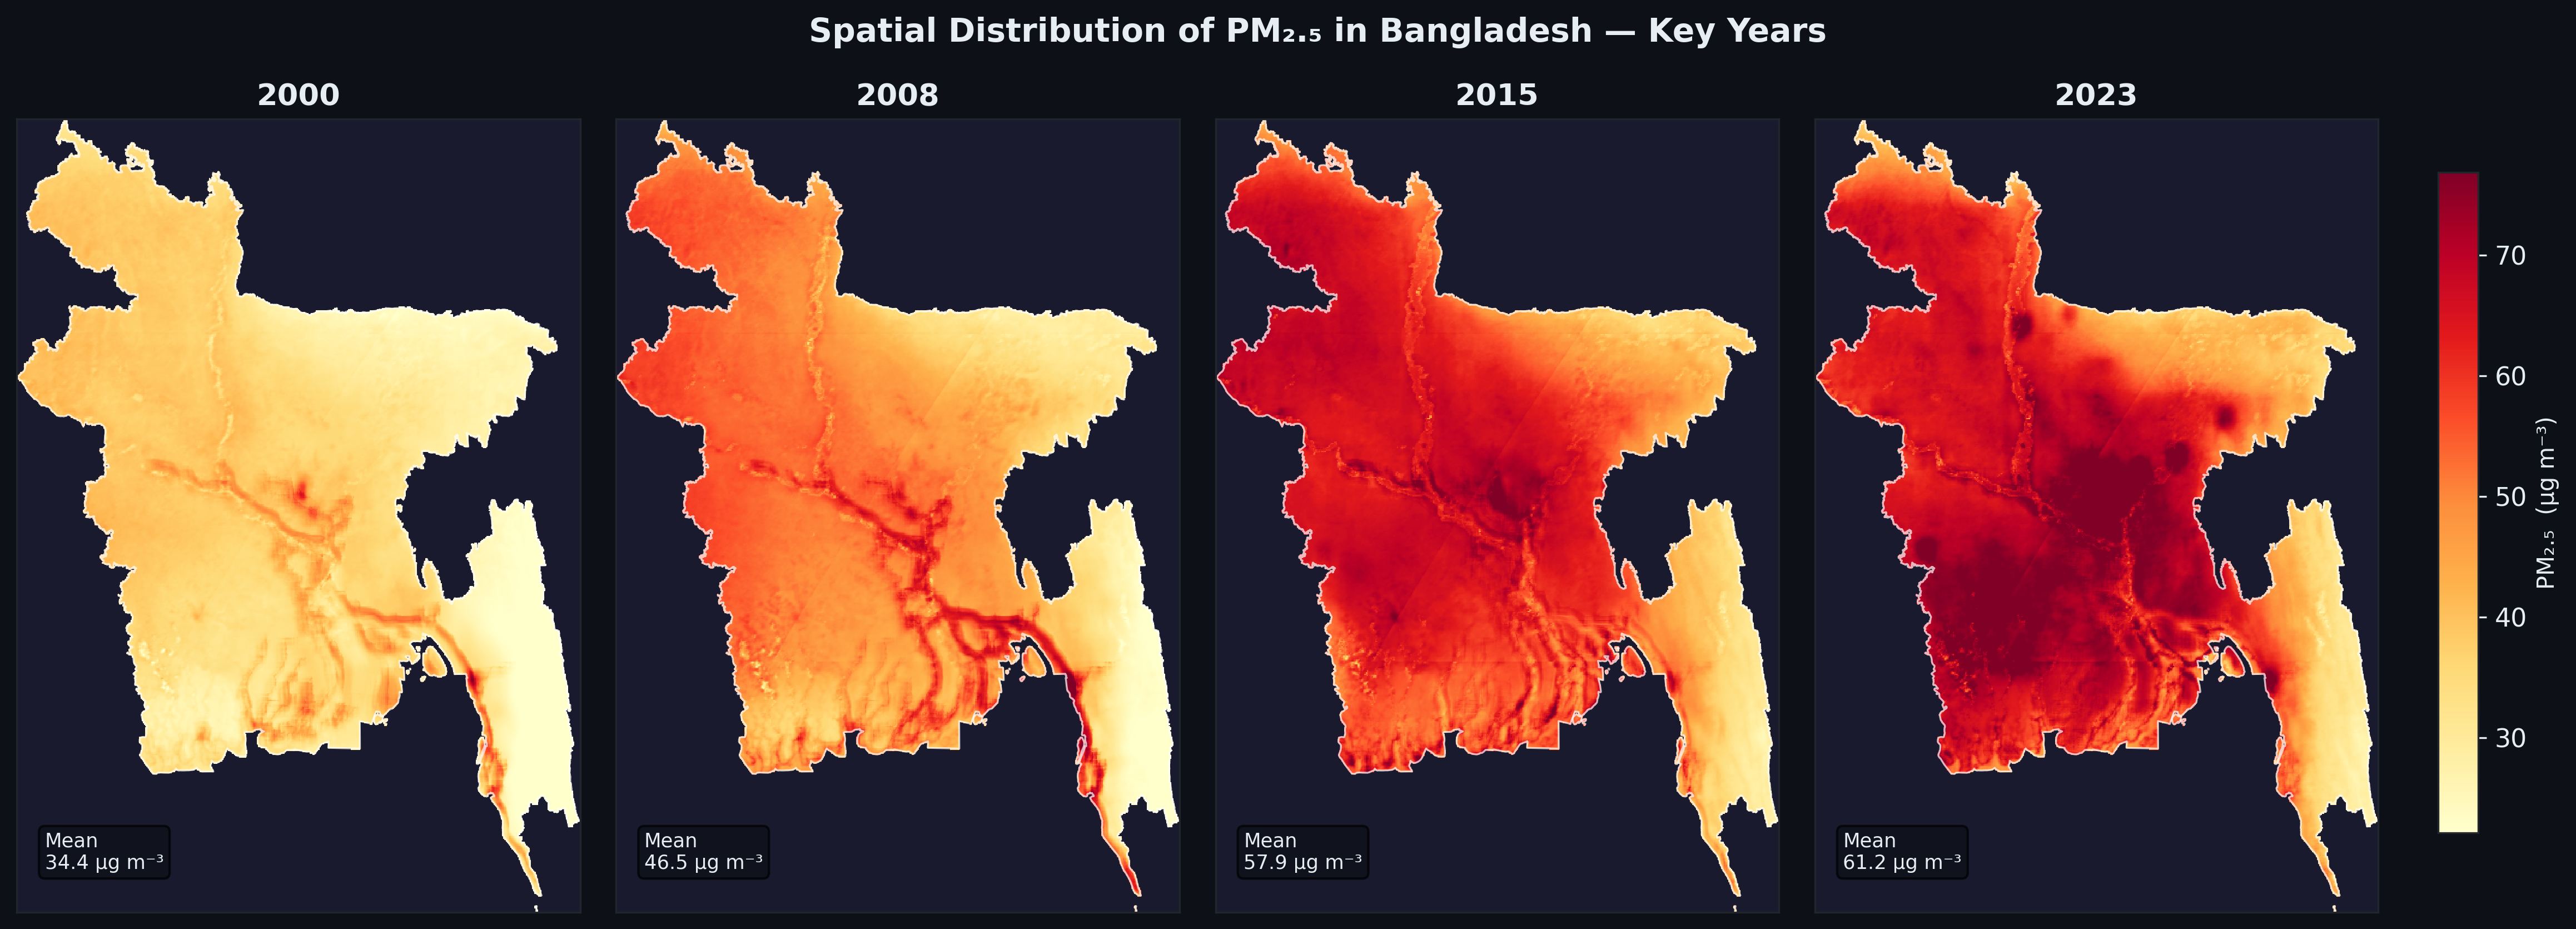
02 · Spatial distribution of PM₂.₅ in Bangladesh at key years: 2000, 2008, 2015 and 2023
🗺️
2000
Mean: 34.4 µg m⁻³
Light orange blankets most of Bangladesh. Only isolated river-corridor hotspots near Dhaka are elevated. Sylhet and coastal south are relatively cleaner.
🔥
2008
Mean: 46.5 µg m⁻³
Intense reddening along major river corridors and urban centres. The north-west (Rajshahi, Rangpur) begins to darken as agriculture fires and brick kilns intensify.
🌋
2015
Mean: 57.9 µg m⁻³
Near-uniform deep red across the country. Only Sylhet and the southern coast retain lighter tones. The central Ganges-Brahmaputra plains are deeply polluted.
💀
2023
Mean: 61.2 µg m⁻³
Dark crimson across the north and centre. The pollution envelope has thickened and expanded. Only isolated areas near major water bodies show slight relief.
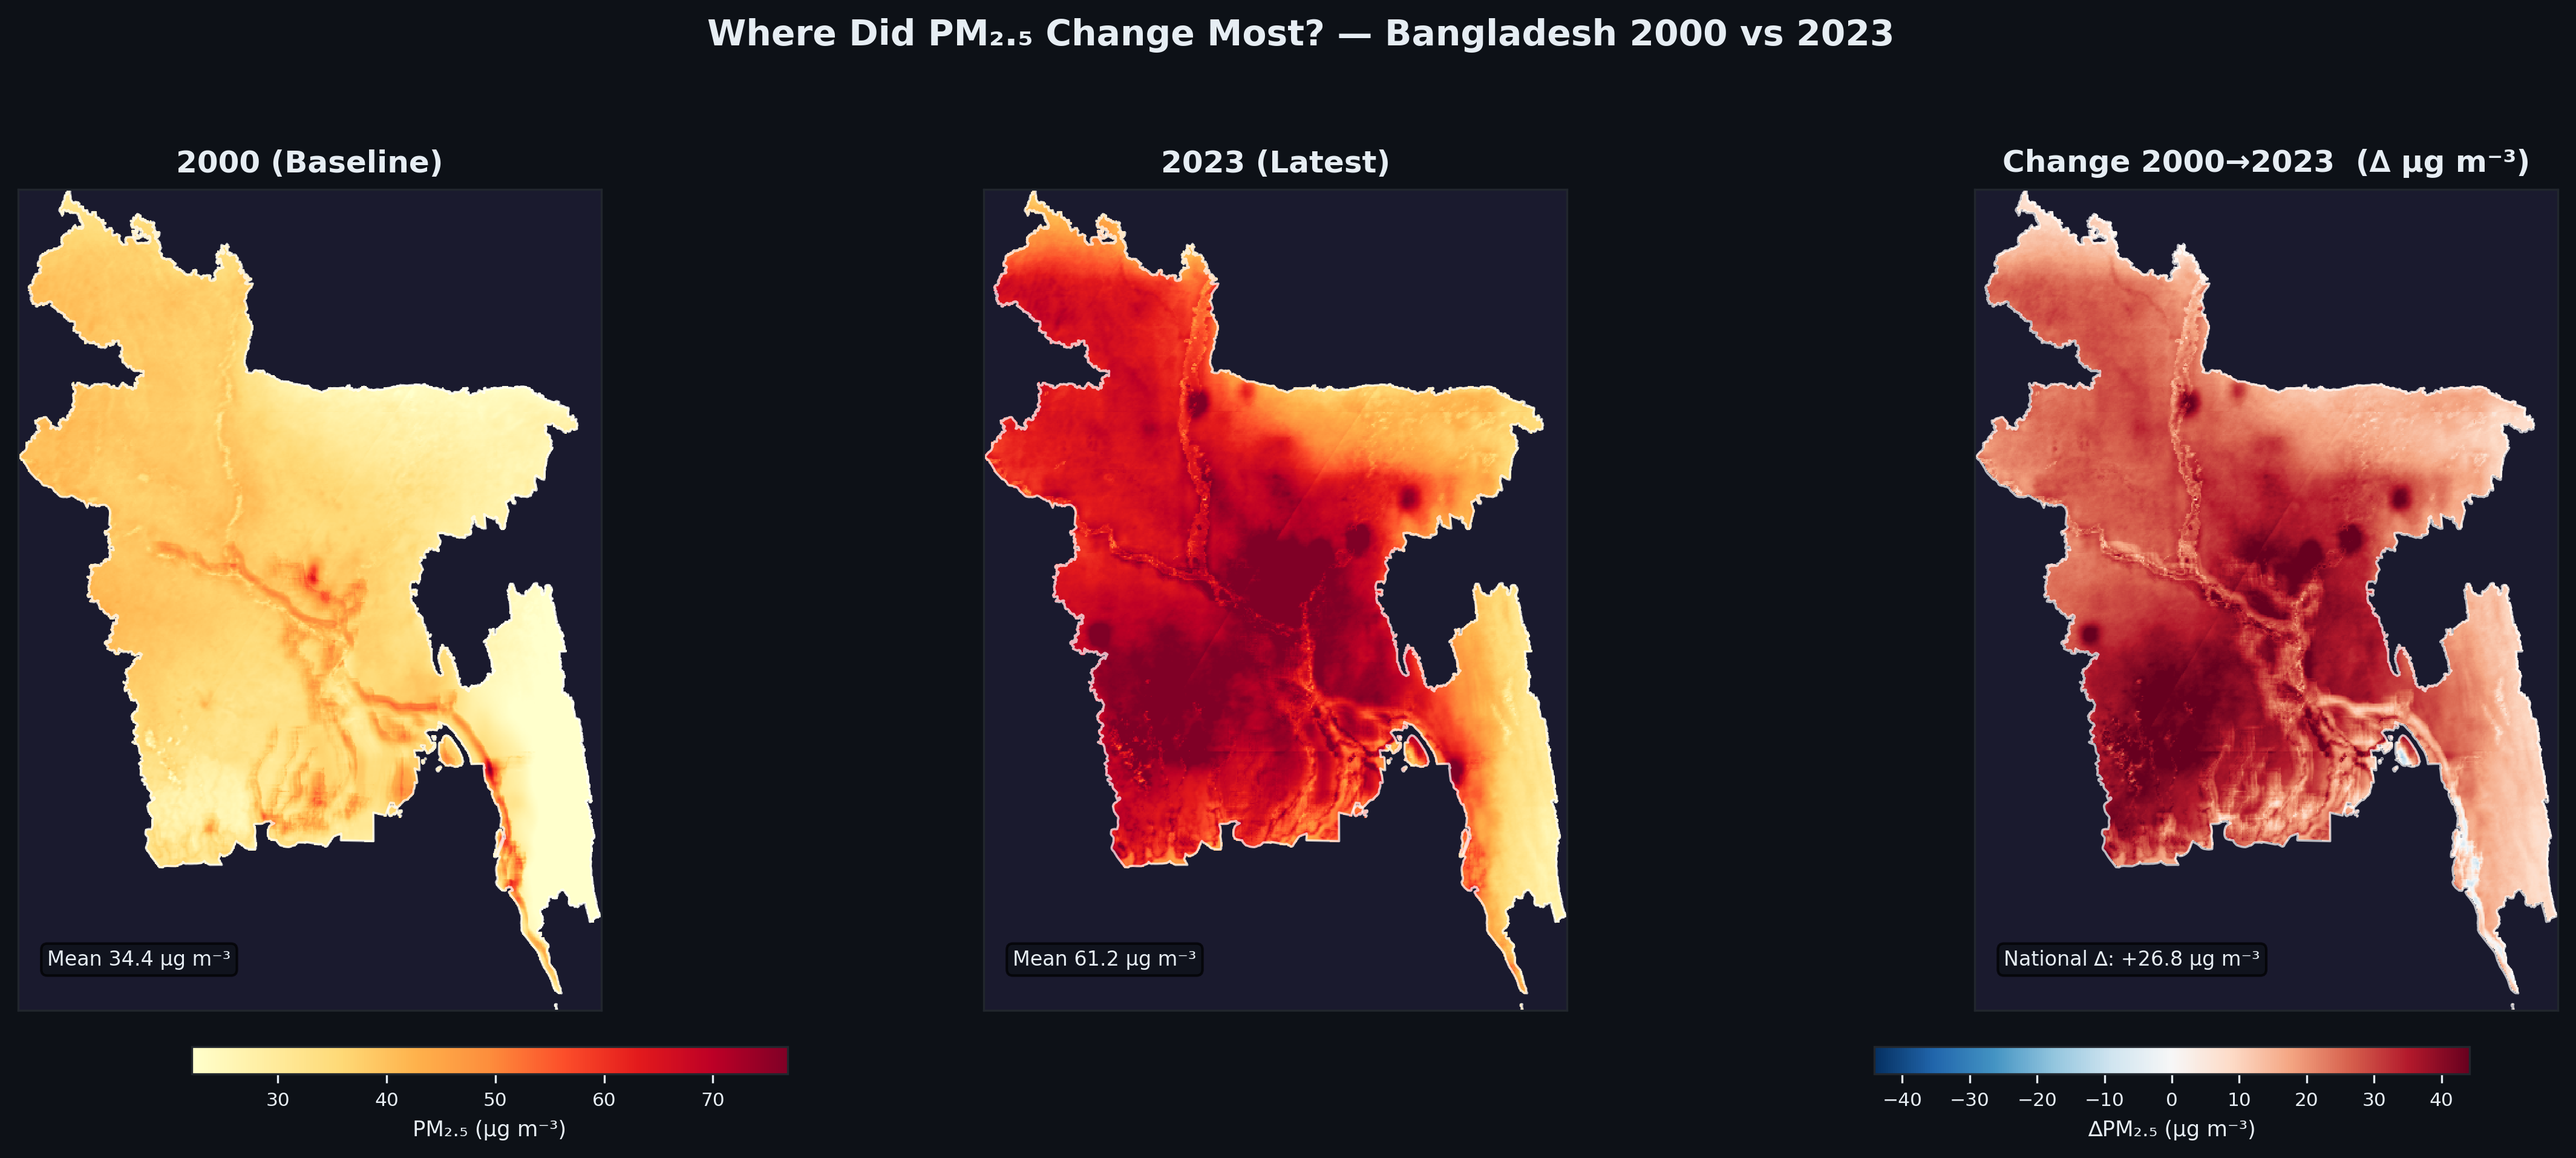
03 · Spatial change in PM₂.₅: 2000 baseline vs 2023 latest — national Δ of +26.8 µg m⁻³
No part of Bangladesh has seen declining PM₂.₅. The change map (2000→2023) shows increases across all regions without exception. The darkest reds in the change map correspond to the north-central belt — Dhaka, Rajshahi, and Khulna divisions — where growth in manufacturing, transport and biomass burning has been most intense.
Chapter 05
What This Means
Numbers tell part of the story. Understanding the drivers and health implications puts the data in its full, urgent context.
🏭
Primary Driver
Brick kilns — Bangladesh has over 8,000 traditional Fixed Chimney Kilns (FCKs), concentrated in peri-urban areas, operating on high-sulphur coal during the dry season. Combined with diesel transport, construction dust, and transboundary pollution from India, they form the core of Bangladesh's PM₂.₅ burden.
🌬️
Seasonality
Annual means mask extreme winter peaks. November–February concentrations can exceed 150–200 µg m⁻³ in Dhaka — 30–40× the WHO guideline — due to temperature inversions trapping pollution near the surface and reduced monsoon washout.
❤️
Health Burden
Chronic exposure above 35 µg m⁻³ is linked to ischaemic heart disease, stroke, COPD, lung cancer and reduced life expectancy. Bangladesh's population of ~170 million is entirely exposed above this threshold every year in this dataset.
🌧️
Monsoon Relief
The annual mean partially reflects monsoon washout from June–September, which temporarily suppresses PM₂.₅. The structural worsening of annual means despite this natural cleansing underscores how severe dry-season pollution has become.
🌏
Transboundary Pollution
Bangladesh sits at the eastern end of the Indo-Gangetic Plain — one of the world's most polluted airsheds. Westerly winds carry PM₂.₅ from India's Gangetic states, particularly during post-harvest stubble burning seasons, amplifying Bangladesh's own emissions.
🔬
Data Source
This analysis is derived from satellite-based PM₂.₅ estimates (surface-calibrated remote sensing), which provide consistent, spatially continuous coverage across the full 2000–2023 period — complementing and extending sparse ground-monitor networks.
The trajectory is unambiguous. In 24 years, Bangladesh's PM₂.₅ has risen from 6.9× to 12.2× the WHO guideline. Every division, every decade, every year — the arrow points in one direction. Meaningful intervention requires urgent, multi-sectoral action: kiln modernisation, vehicle emission standards, transboundary agreements, and land-use regulation. The science is clear; the crisis is now.