Bay of Bengal Climate Analysis · 1960–2025

El Niño & La Niña
and the Bay of Bengal

How small changes in Pacific sea surface temperatures reshape monsoons, cyclones, and marine climate across one of Earth's most vulnerable ocean basins.

165
El Niño months
341
Neutral months
286
La Niña months
522
BoB storms tracked
Scroll to explore

01 — ENSO Index

Reading the Pacific's Heartbeat

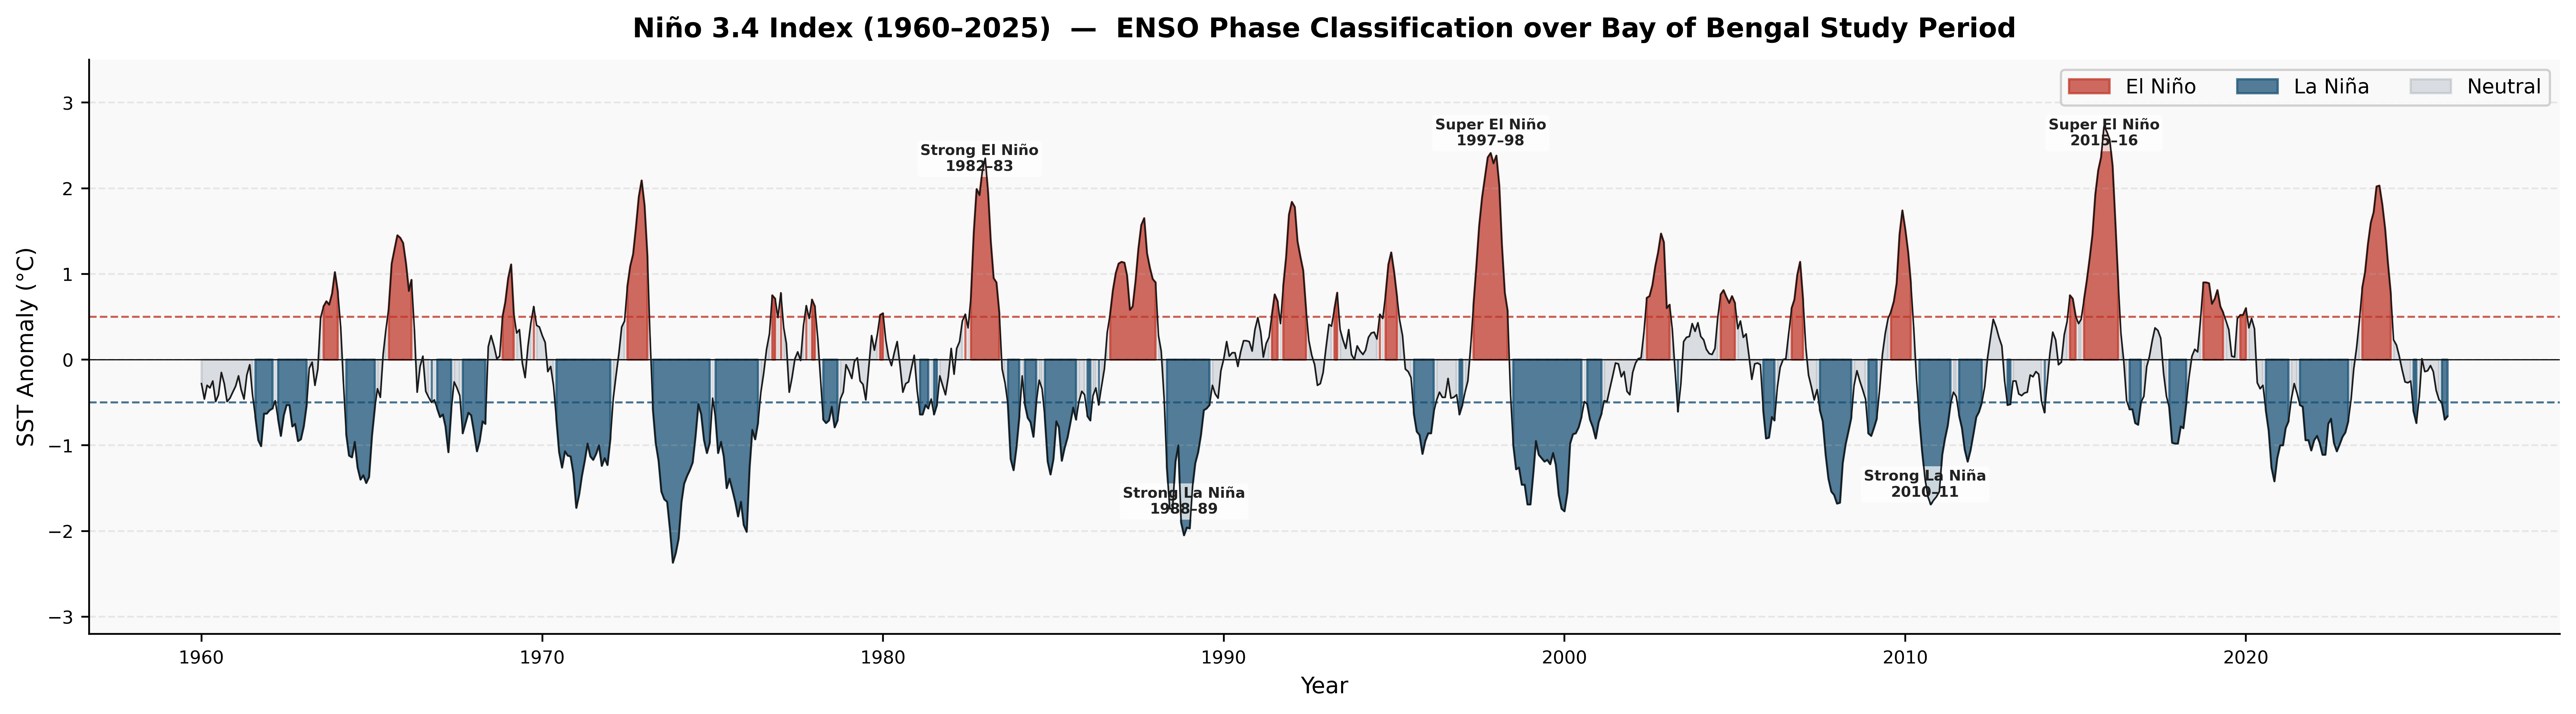
The Niño 3.4 anomaly index classifies each month as El Niño (+0.5°C), La Niña (−0.5°C), or Neutral. Over 65 years, the Pacific has alternated between these phases in irregular 2–7 year cycles, with each phase leaving a distinct fingerprint on the Bay of Bengal.
Niño 3.4 index 1960–2025
Fig. 01 Niño 3.4 SST anomaly (°C) from 1950–2025. Red fill = El Niño (≥+0.5°C); blue fill = La Niña (≤−0.5°C); grey = neutral conditions. Dashed lines mark the ±0.5°C classification threshold. Key historical events annotated.

El Niño

Three super-events stand out

1982–83, 1997–98, and 2015–16 each exceeded +2°C anomaly — the strongest signals in the 65-year record, with global climate disruption well documented in each case.

La Niña

La Niña dominates in duration

286 La Niña months vs 165 El Niño months across the record. La Niña events tend to be longer-lasting and have been more frequent since the late 1990s.

Pattern

Oscillation every 2–7 years

The irregular ENSO cycle follows no fixed period, but the post-2000 era shows more frequent La Niña dominance, which has profound implications for BoB cyclone activity.
02 — Sea Surface Temperature

How the Pacific Cools or Warms the Bay

El Niño suppresses BoB sea surface temperatures through altered atmospheric teleconnections, while La Niña allows greater warming — particularly in the southern Bay where SST differences are statistically significant.

SST anomaly composite maps
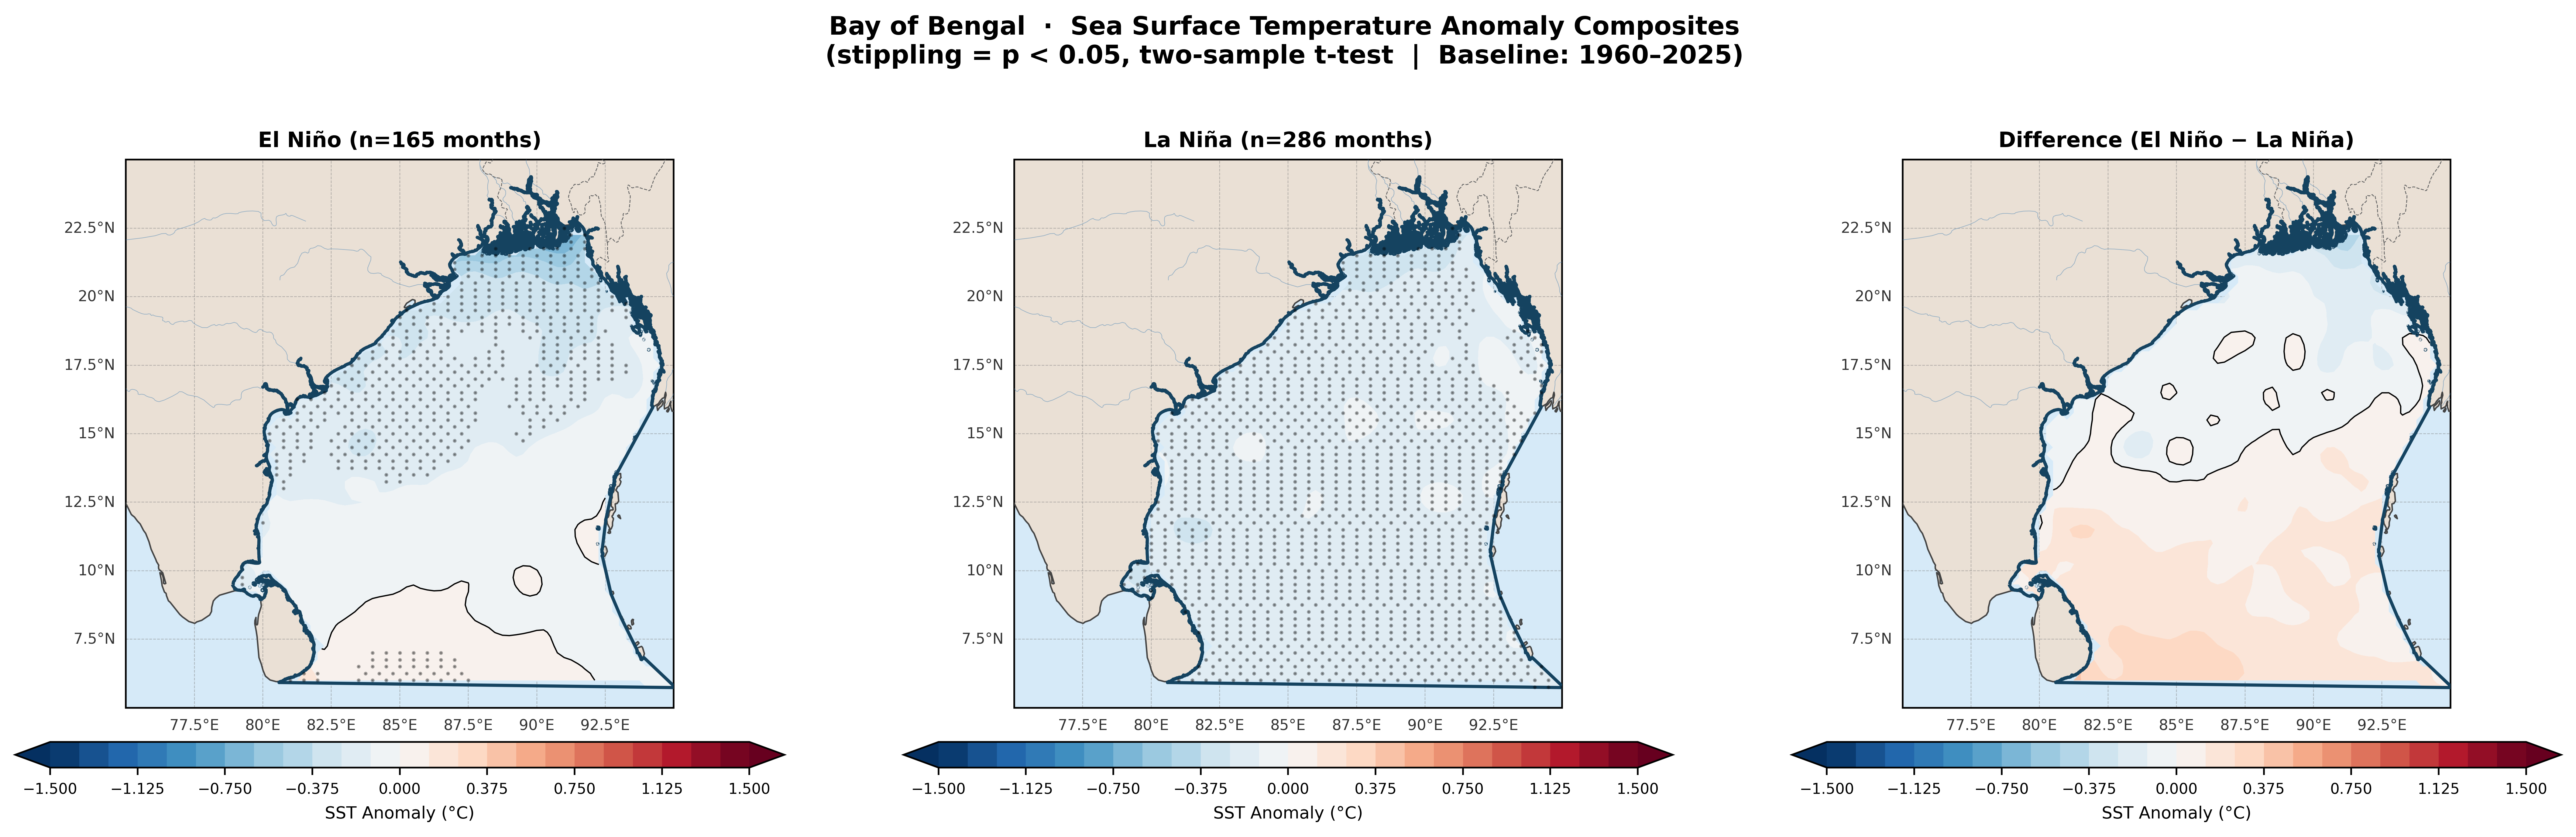
Fig. 02 SST anomaly composites for El Niño (left), La Niña (centre), and their difference (right). Stippling indicates statistical significance at p<0.05 via two-sample Welch's t-test. Baseline: 1960–2025 ERA5 climatology.
02

Key Finding

Southern BoB SST responds significantly to ENSO

During El Niño, SSTs across most of the BoB are 0.3–0.8°C below climatological norms — the southern basin (below ~12°N) shows the strongest and most statistically significant cooling, confirmed by stippled significance.

During La Niña, the signal is reversed but weaker in magnitude. The central and northern BoB shows near-neutral to slight warming. The difference map (El Niño − La Niña) clearly isolates the southern basin as the most ENSO-sensitive zone of the Bay.

Mechanism: El Niño enhances the Walker Circulation's descending branch over the Indian Ocean, suppressing evaporation and convection, reducing latent heat flux that normally warms the BoB surface.

SST vs Nino3.4 correlation
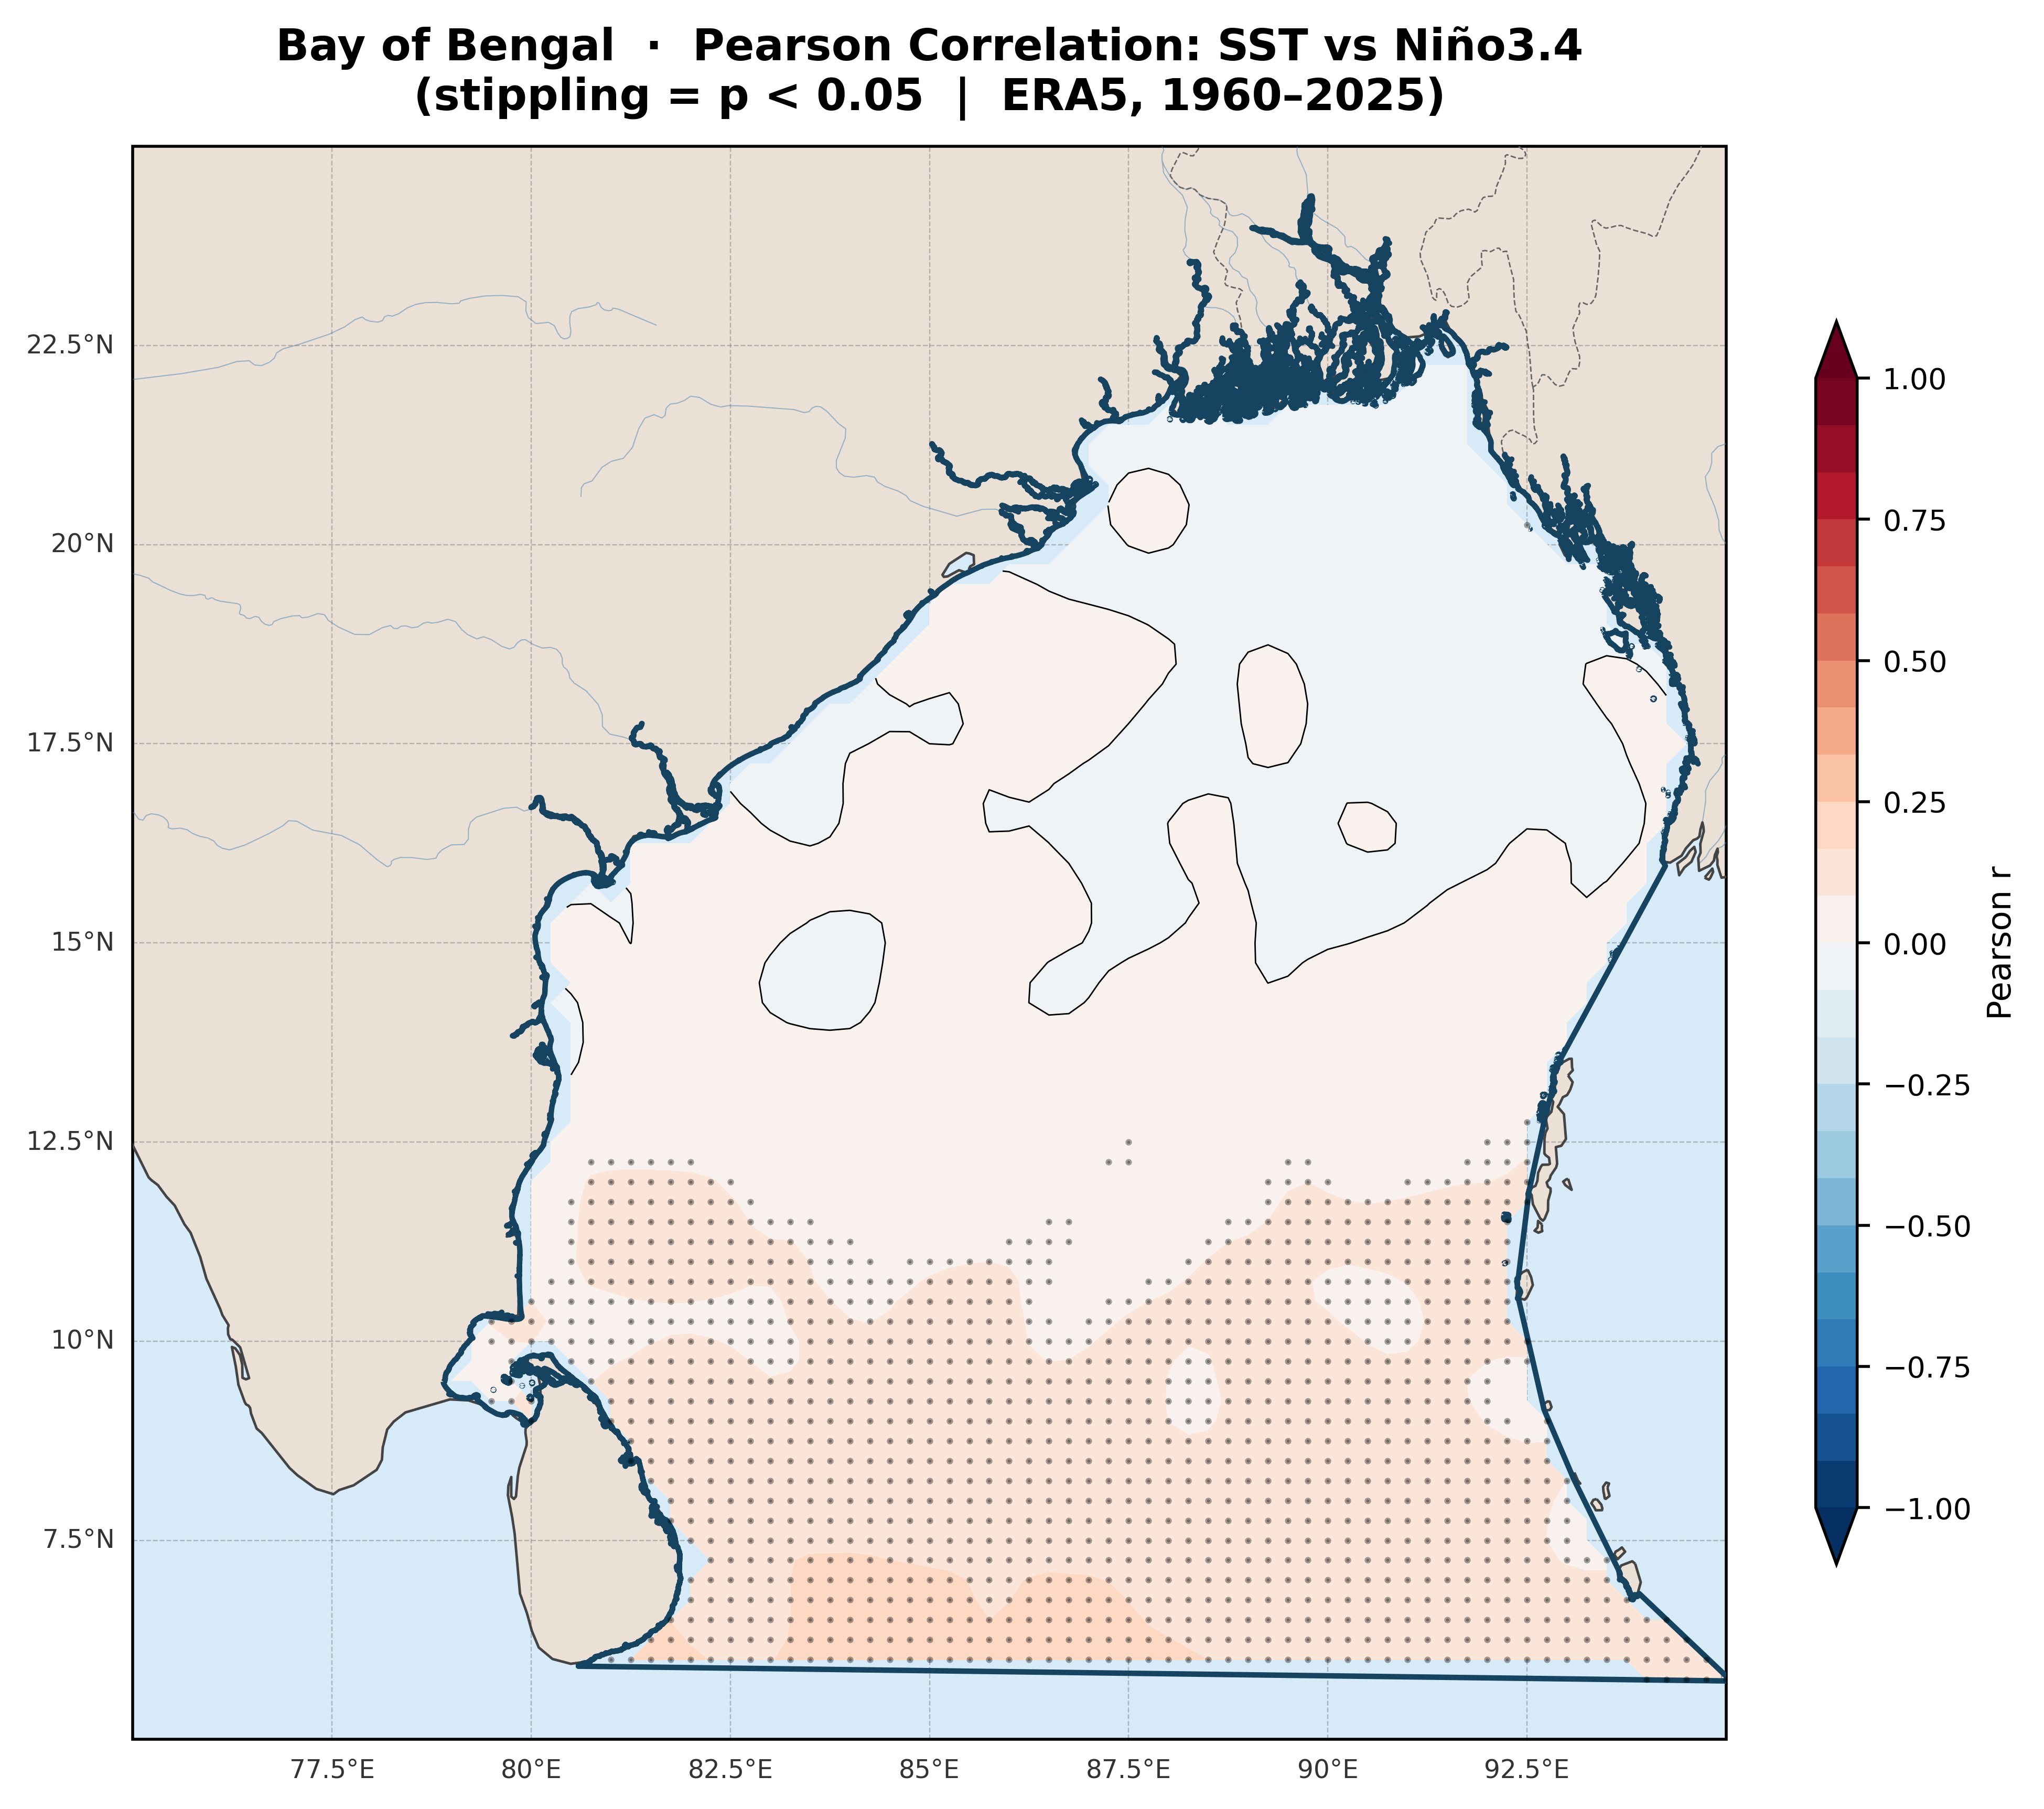
Fig. 09 Pearson correlation between BoB SST and the Niño3.4 index. Positive (warm-red) values in the south indicate BoB SST rises with El Niño — consistent with ENSO's direct SST forcing. Significant only south of ~12°N.

03 — Precipitation & Monsoon

Monsoon Rainfall Under ENSO's Influence

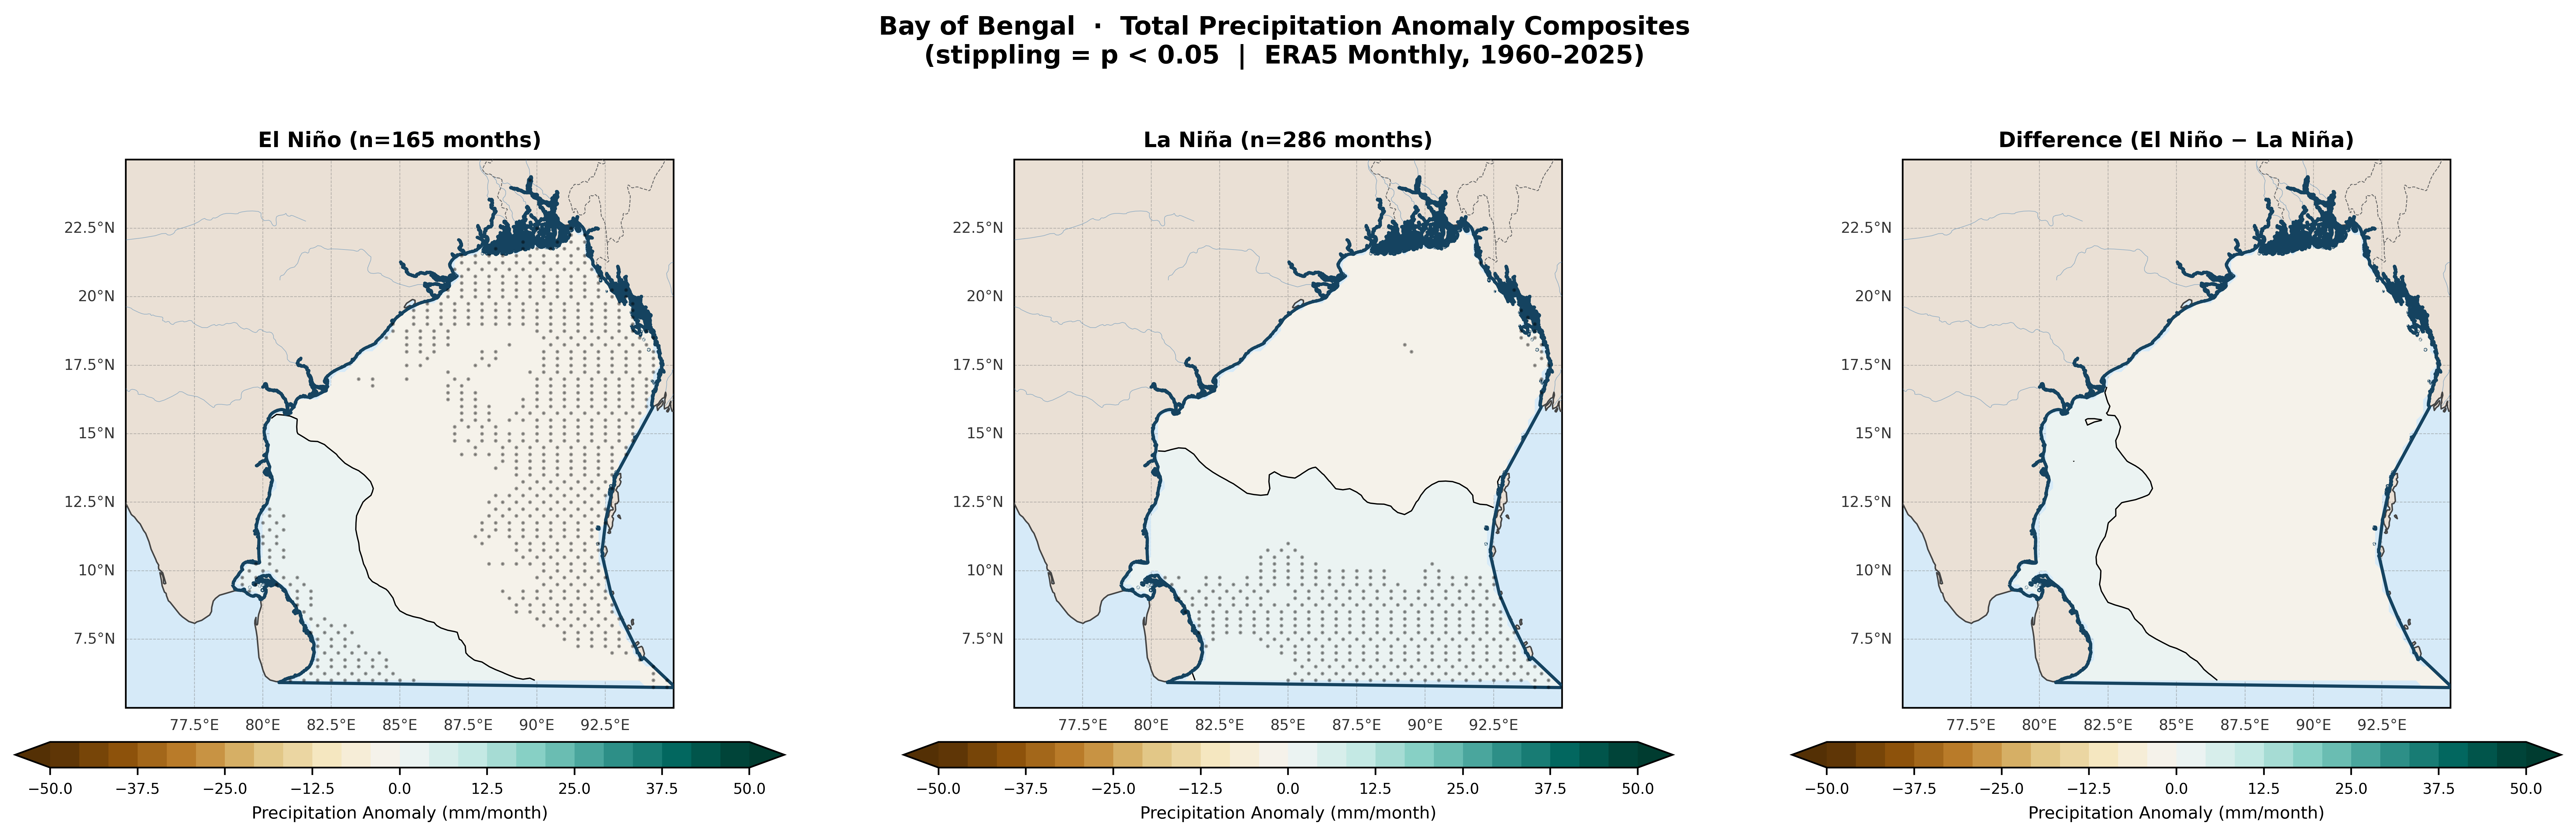
El Niño is the leading external driver of Indian monsoon deficit years. The precipitation anomaly composite over the BoB region shows clear suppression during El Niño months, with statistically significant drying across the northern basin.

Precipitation anomaly composite
Fig. 03 Total precipitation anomaly (mm/month) composites for El Niño and La Niña phases. Stippling marks statistically significant grid cells (p<0.05). Brown tones = drier; green tones = wetter relative to 1960–2025 mean.

El Niño Effect

Northern BoB experiences significant rainfall deficit — stippling concentrated here indicating p<0.05 across a broad area
Anomalies reach −15 to −25 mm/month in the central basin during peak El Niño months
Southern tip shows modest positive anomaly — a split dipole structure common in ENSO-forced Indian Ocean precipitation

La Niña Effect

Precipitation anomalies are weak and largely insignificant (very sparse stippling in La Niña panel)
Slight positive anomaly in the southern BoB consistent with enhanced convection during La Niña years
The asymmetry — El Niño suppresses strongly, La Niña enhances weakly — is a well-known ENSO–monsoon characteristic

Monsoon Season

JJAS: the critical season for rainfall differences

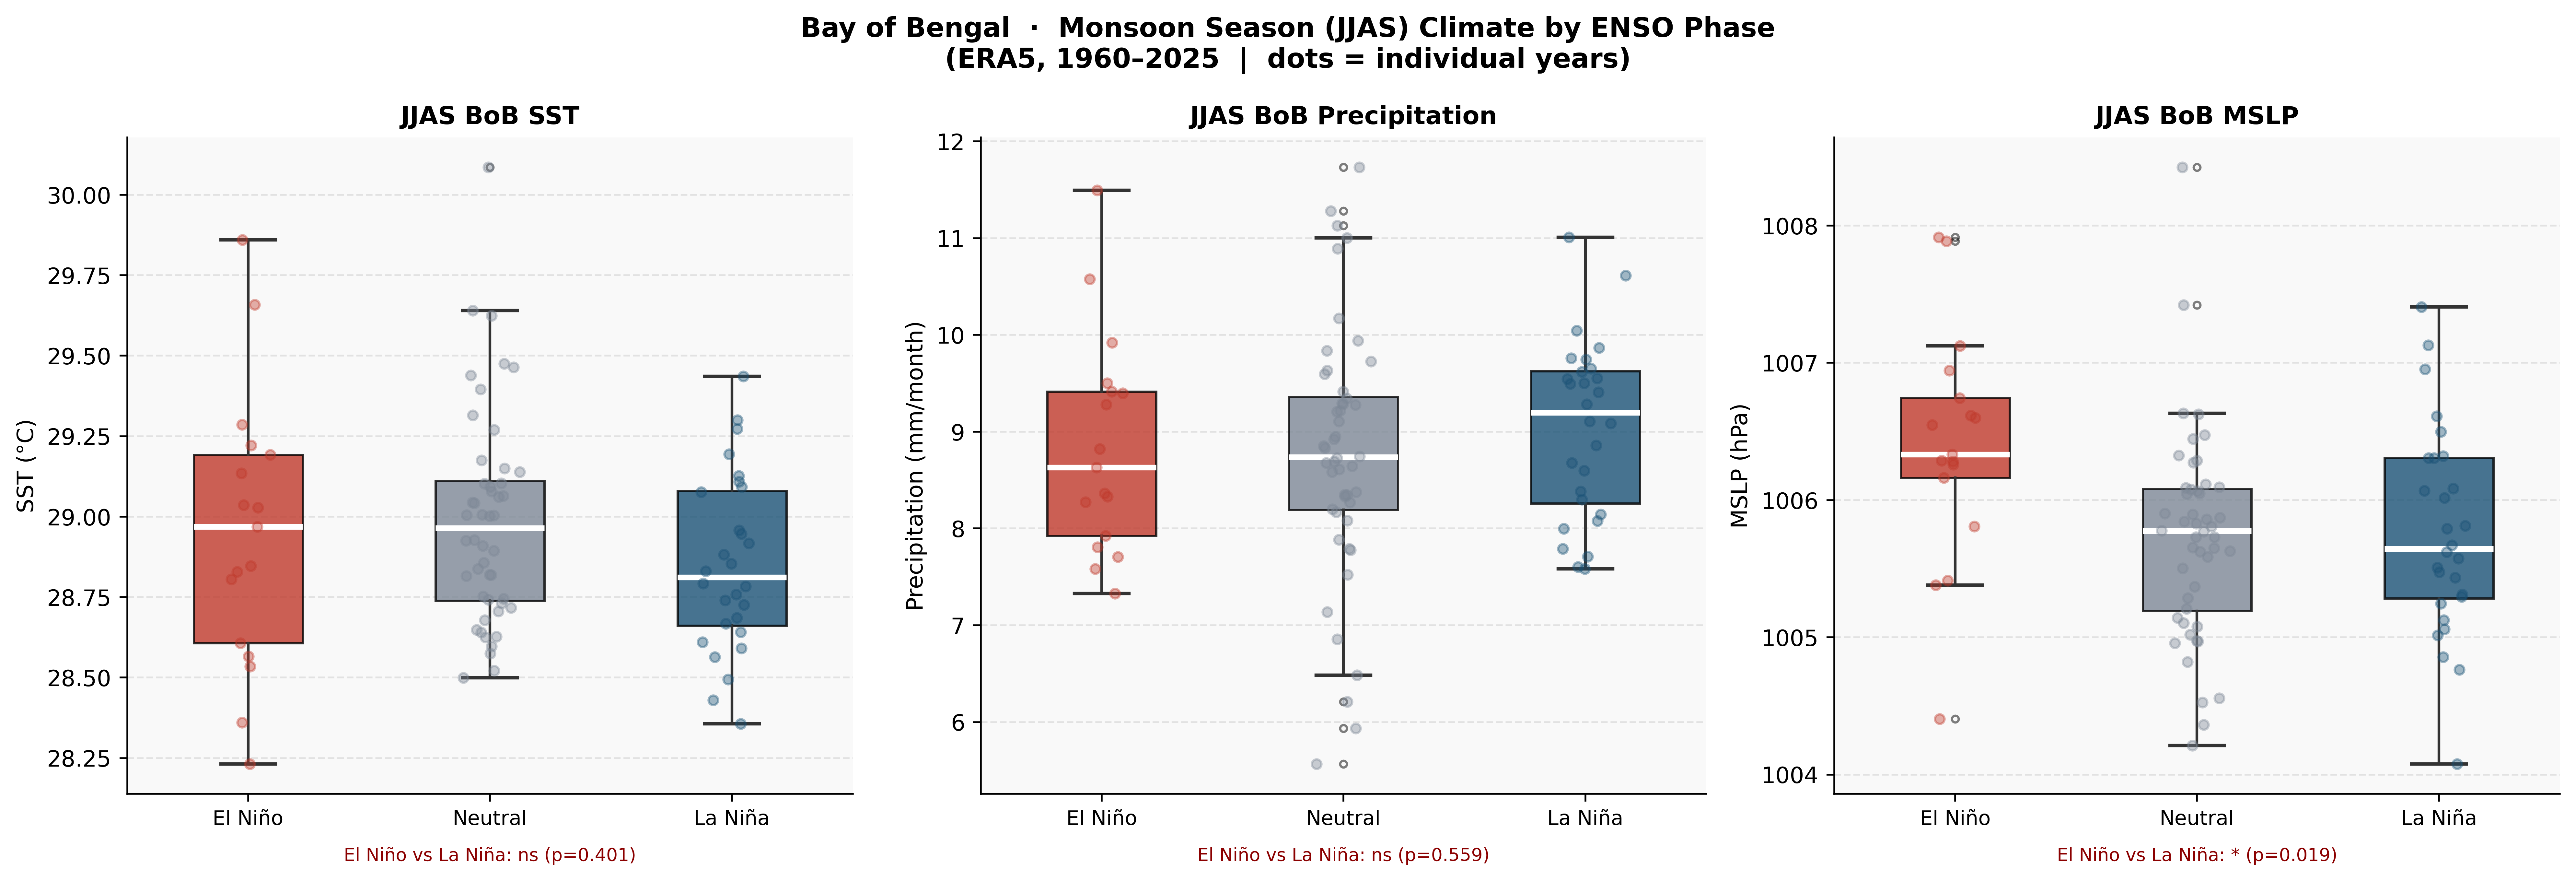
The JJAS monsoon box plots (Fig. 10) show that precipitation is marginally higher during El Niño years over the BoB domain average (mean ~9 mm/month El Niño vs ~9.4 mm/month La Niña). The difference is not statistically significant (p=0.559), suggesting that the precipitation signal seen in the composite maps is concentrated in specific sub-regions and seasons rather than the full domain average. MSLP however shows a significant difference — El Niño years have higher pressure (1006.5 hPa) vs La Niña years (1005.8 hPa), p=0.019.

JJAS boxplots by ENSO phase
Fig. 10 JJAS monsoon season distributions of BoB SST, precipitation, and MSLP by ENSO phase. Individual years shown as jittered points. Significance labels shown at bottom of each panel.
Seasonal cycle by ENSO phase
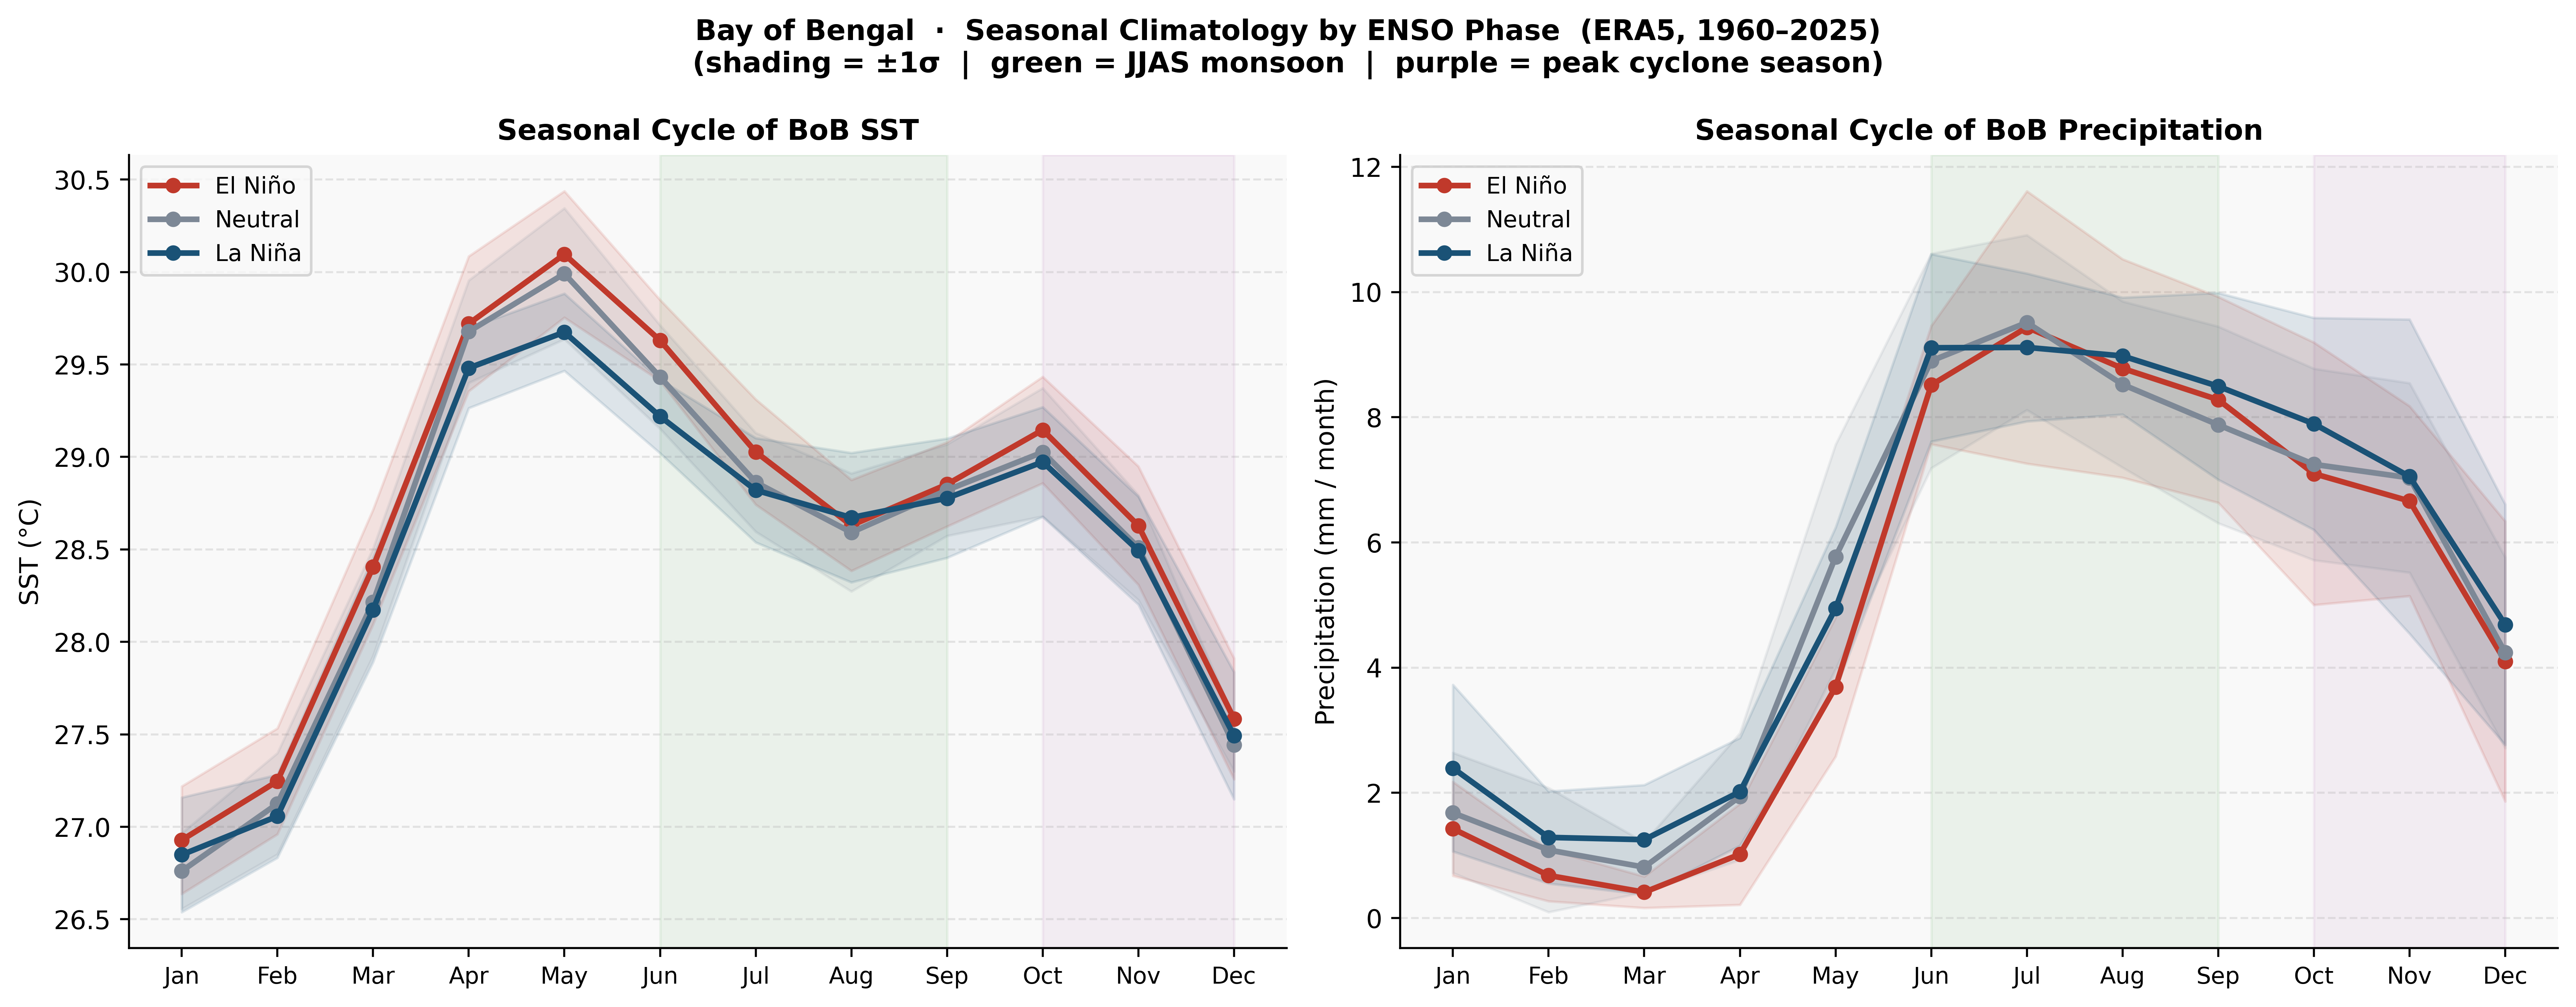
Fig. 08 Monthly climatology of BoB SST (left) and precipitation (right) by ENSO phase. Shading = ±1σ. Green band = JJAS monsoon season; purple = peak cyclone season (Oct–Dec). El Niño (red) shows warmer pre-monsoon SSTs (Apr–May) but converges during monsoon onset.

Key seasonal insight (Fig. 08): El Niño SSTs peak higher in April–May (+0.3°C above La Niña) but both phases converge by June–July during monsoon onset. La Niña shows slightly elevated precipitation throughout the cyclone season (Oct–Dec), consistent with enhanced convective activity in La Niña years.

04 — Atmospheric Circulation

Wind Patterns and Pressure Anomalies

ENSO reshapes the large-scale atmospheric circulation over the BoB through modulation of low-level wind vectors and sea-level pressure — directly influencing storm formation potential and monsoon delivery.

Wind anomaly composite maps
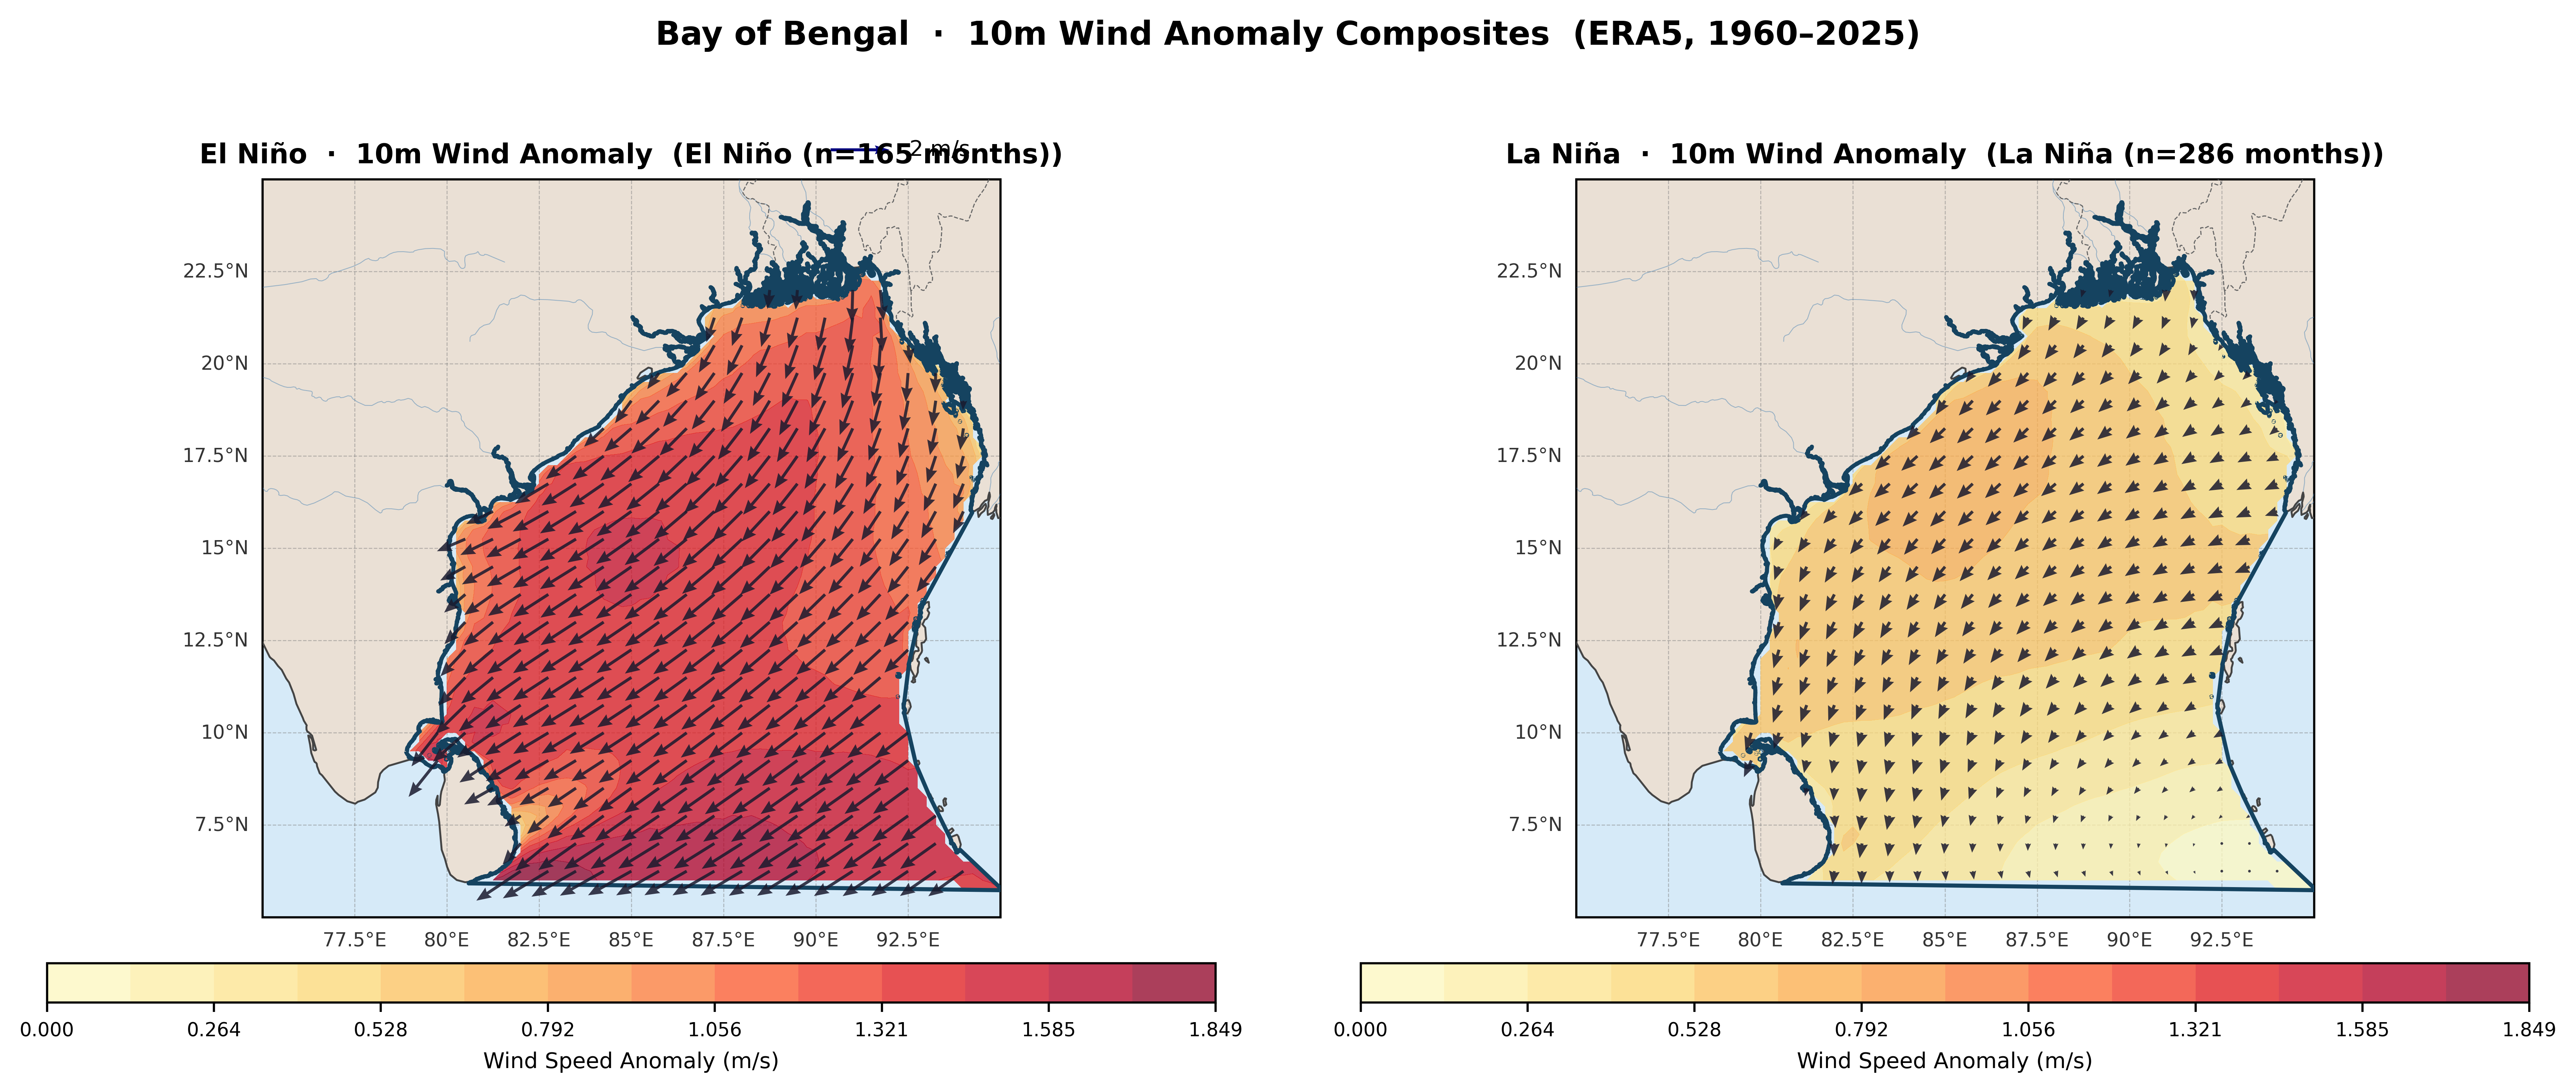
Fig. 04 10m wind anomaly composites. Filled contours show wind speed anomaly magnitude (m/s); arrows show anomaly direction. El Niño shows a strong southward–westward anomalous flow; La Niña shows weaker, more uniform eastward anomalies.

Wind Structure

El Niño drives anomalous convergence toward western BoB

The El Niño wind anomaly map (Fig. 04) is striking — anomalous winds reach 1.5–1.85 m/s in the western BoB and along the Indian eastern coast, with vectors pointing generally southward-westward. This is consistent with anomalous anticyclonic circulation induced by El Niño's suppression of the monsoon trough, weakening the typical south-westerly monsoon flow.

The La Niña panel shows considerably weaker wind anomalies (0.5–1.0 m/s), with more spatially uniform eastward vectors — characteristic of a strengthened trade wind response.

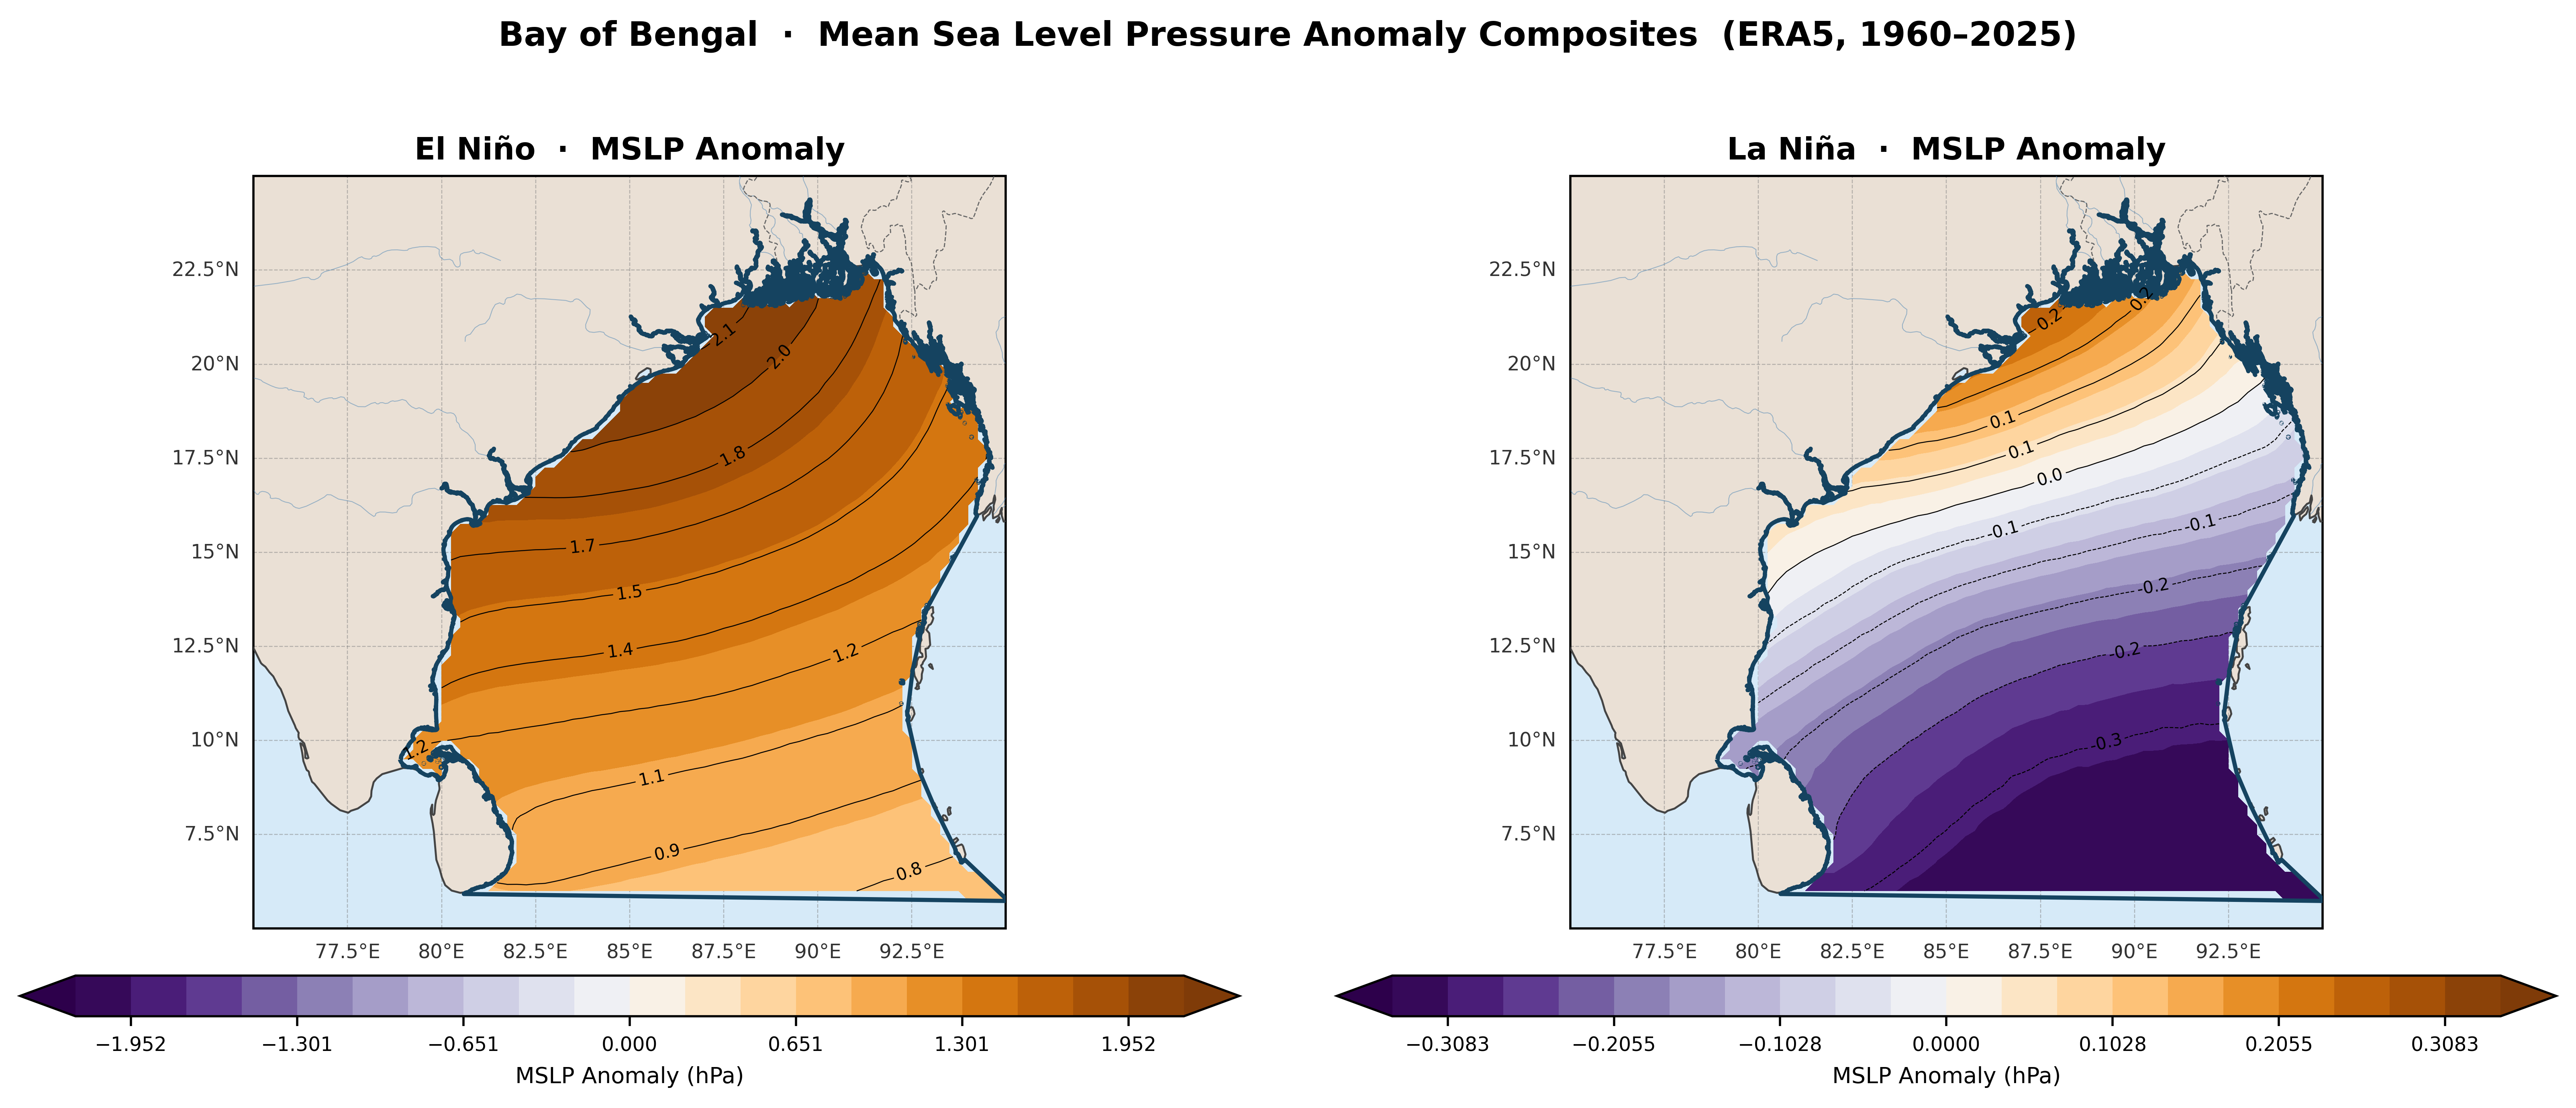
MSLP anomaly composite
Fig. 05 Mean sea level pressure anomaly (hPa) for El Niño (left) and La Niña (right). El Niño shows a strong positive anomaly (+0.8 to +2.1 hPa) — a higher-pressure regime — while La Niña shows a weak negative anomaly (−0.3 to 0 hPa), indicating slightly lower pressure conducive to convection and storm development.

MSLP interpretation (Fig. 05): During El Niño, anomalously high pressure (+1 to +2 hPa) suppresses deep convection across the BoB — a hostile environment for cyclone genesis. During La Niña, pressure anomalies are weakly negative, maintaining a more favourable convective environment. This pressure asymmetry (statistically significant at p=0.019 in JJAS) partly explains higher La Niña cyclone counts.

05 — Tropical Cyclones

Cyclone Activity Across ENSO Phases

IBTrACS records from 1960–2025 show 522 named storms in the Bay of Bengal. Their distribution by ENSO phase reveals a clear but statistically non-significant tendency toward higher cyclone frequency during La Niña years.

111
El Niño storms
200
La Niña storms
211
Neutral storms
5.29
La Niña mean/year
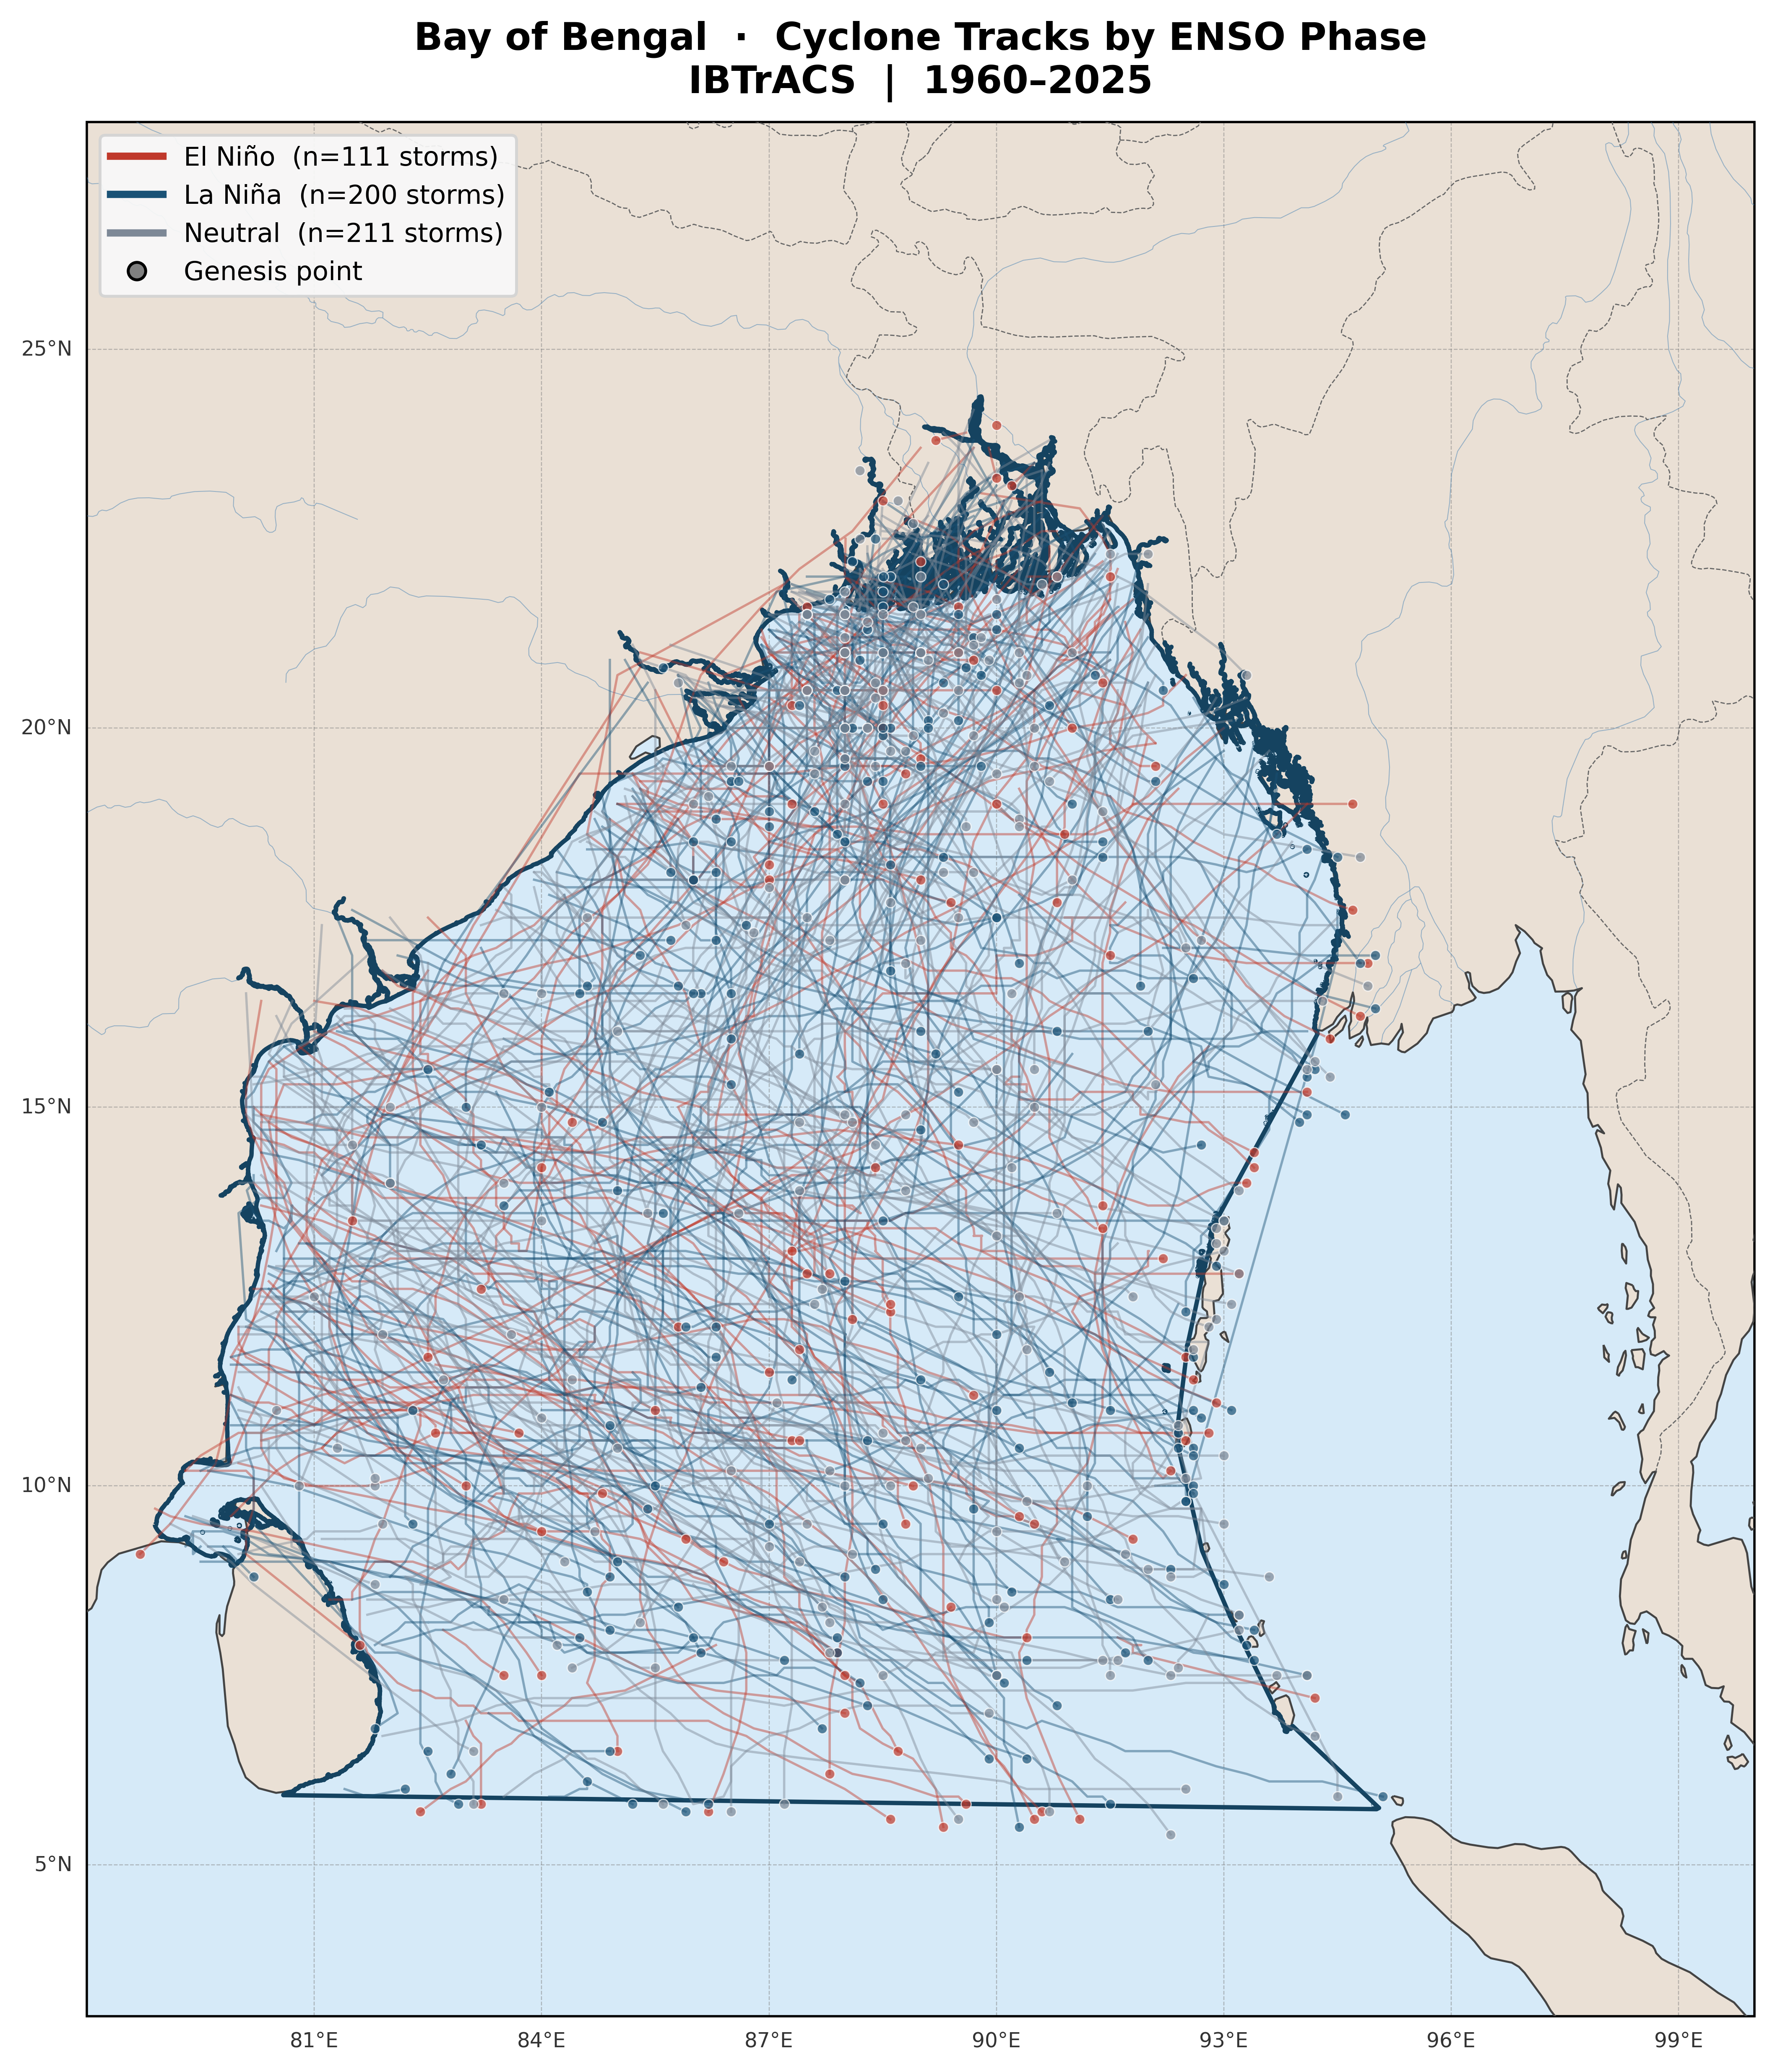
Cyclone track map by ENSO phase
Fig. 06 IBTrACS cyclone tracks (1960–2025) coloured by dominant ENSO phase. Red = El Niño; blue = La Niña; grey = Neutral. Dots indicate genesis (first track point). La Niña tracks are more numerous and show stronger clustering in the north-central BoB.

Frequency Analysis

La Niña produces ~1.1 more storms per year, but overlap is high

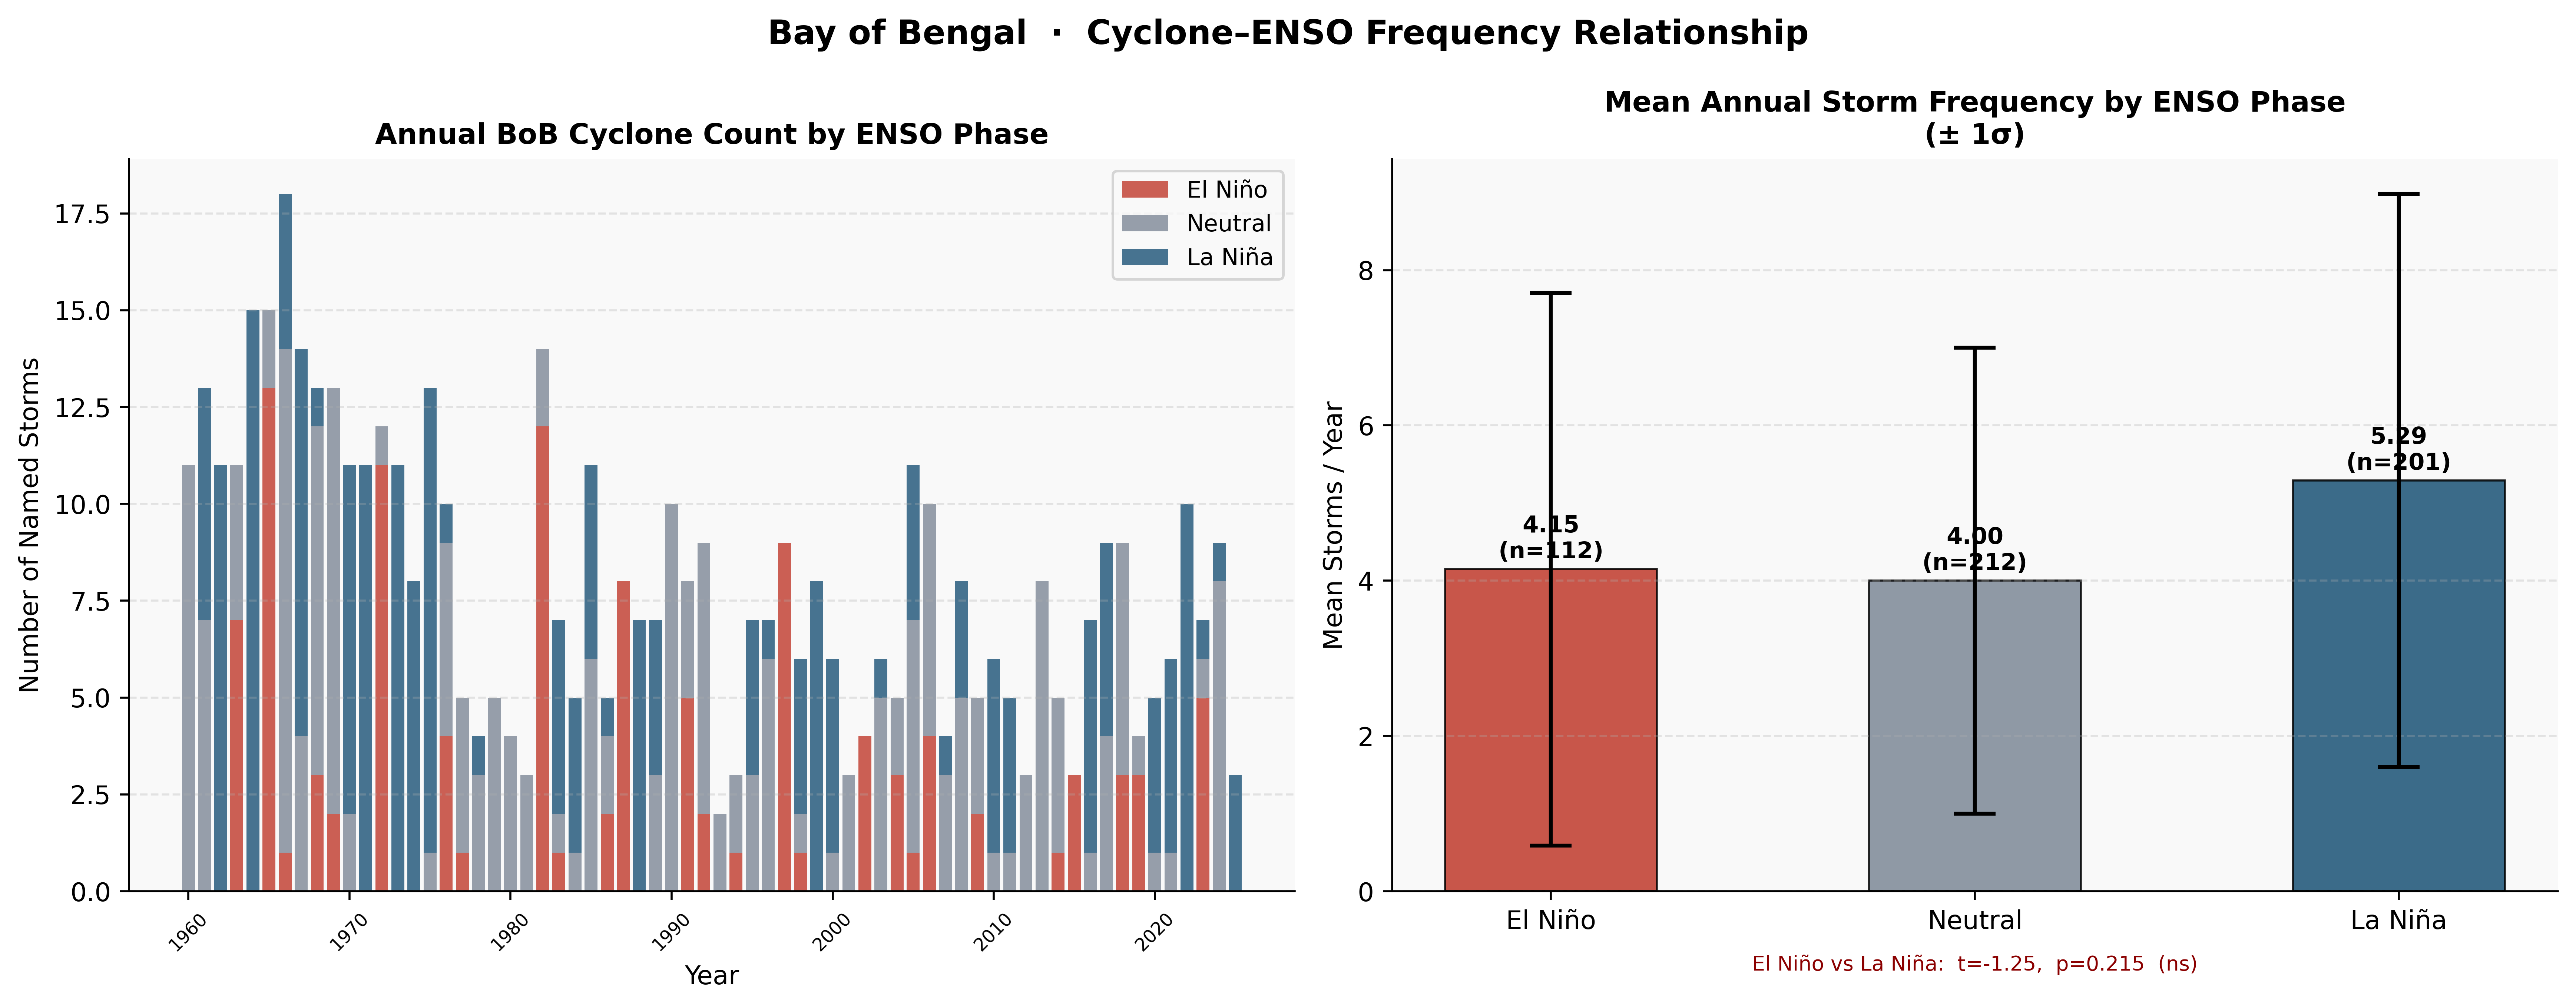
Mean annual storms: La Niña = 5.29, Neutral = 4.00, El Niño = 4.15. The Welch's t-test between El Niño and La Niña returns t = −1.25, p = 0.215 (not significant). The high inter-annual variability (σ ≈ 3–4 storms/year in each phase) means the signal-to-noise ratio is low despite the physically consistent difference in means.

The stacked bar chart (Fig. 07 left) illustrates this clearly — early decades (1960s) had very high neutral + La Niña counts, while more recent years show decline across all phases, likely reflecting changes in observation standards and/or basin-scale climate shifts.

Cyclone frequency analysis
Fig. 07 Left: annual BoB cyclone count stacked by ENSO phase. Right: mean annual storms ±1σ per phase with t-test significance (El Niño vs La Niña: p=0.215, ns). La Niña mean is higher but distributions overlap substantially.
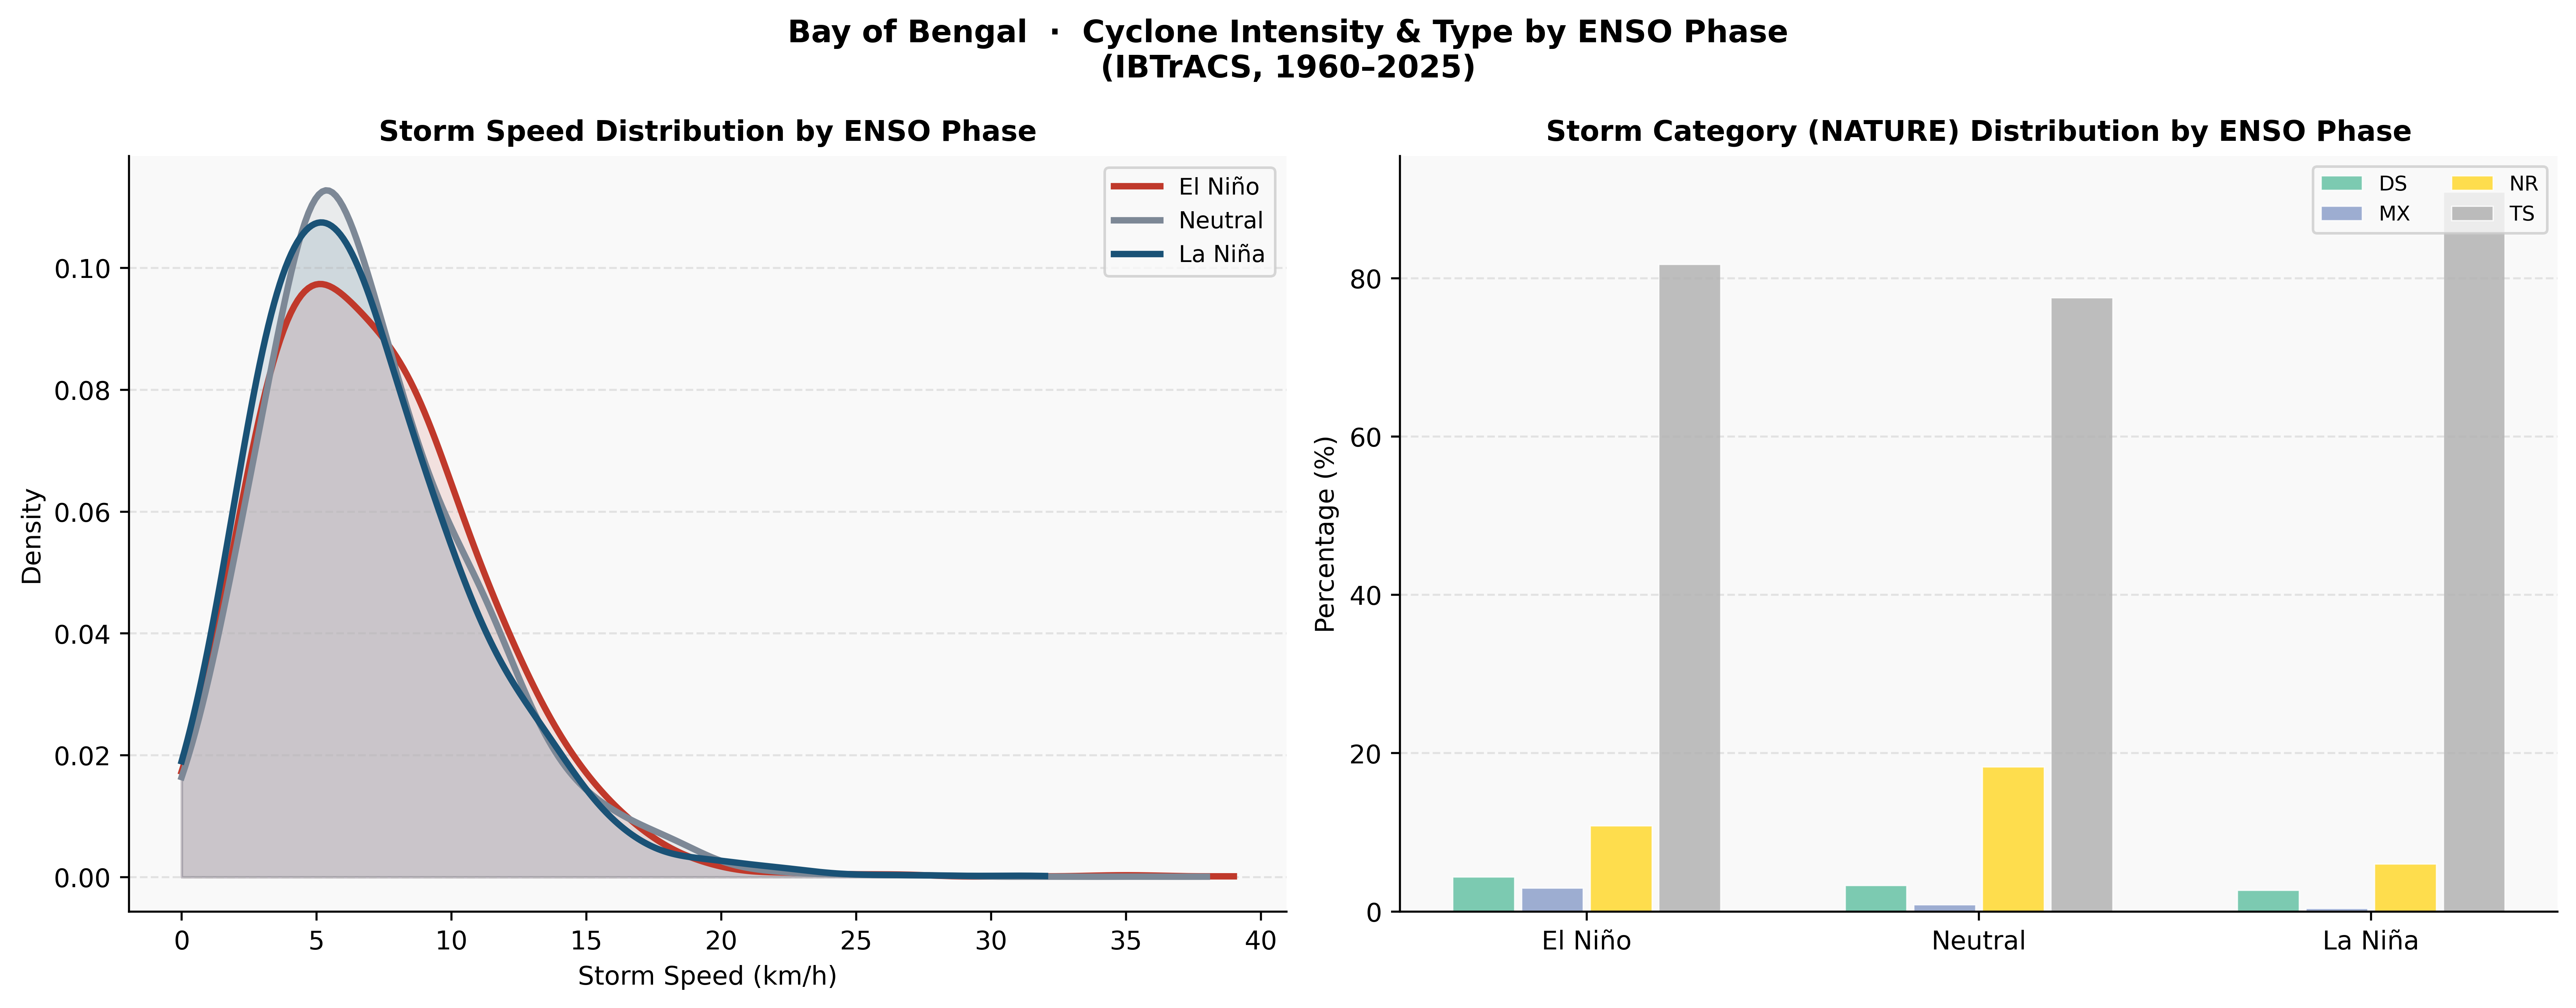
Cyclone intensity by ENSO phase
Fig. 11 Left: KDE of storm speed by ENSO phase — all three phases peak at ~5–7 km/h with La Niña showing slightly higher density at low speeds (slower, more persistent storms). Right: NATURE category breakdown — Tropical Storms (TS) dominate all phases (~80%), but the Neutral phase shows ~18% NR (not rated) storms vs ~10% in El Niño/La Niña.

Intensity

La Niña storms are slightly slower

The speed KDE shows La Niña phase storms have a tighter peak at lower translational speeds (~5 km/h), suggesting slower-moving, potentially more rainfall-intensive storms over the BoB coast.

Category

TS dominates all ENSO phases

Tropical Storm (TS) classification accounts for ~80% of storms in both El Niño and La Niña phases. The storm nature composition does not vary dramatically with ENSO phase.

Genesis

Genesis clustering in north-central BoB

Track map genesis points (Fig. 06) are densest in the north-central BoB (15–20°N, 87–91°E) across all phases, reflecting the warm pool's persistent role as the primary genesis zone.

06 — Statistical Summary

What the Numbers Tell Us

A synthesis of key statistical findings from the composite analysis, seasonal cycle, and cyclone frequency assessments across 65 years of Bay of Bengal climate data.

Summary dashboard
Fig. 12 Summary dashboard: Niño3.4 timeline (top), SST anomaly maps + seasonal cycle (middle), precipitation anomaly maps + storm frequency boxplot (bottom). A self-contained overview of all key findings.

Finding-by-finding verdict

BoB SST anomaly — El Niño cooling
Southern basin shows significant negative SST anomaly (~−0.4 to −0.8°C)
p < 0.05
Strongest signal south of 12°N
BoB precipitation — El Niño suppression
Northern BoB shows significant drying during El Niño months
p < 0.05
Concentrated in north basin, JJAS mean ns
JJAS MSLP difference (El Niño vs La Niña)
El Niño shows measurably higher monsoon-season pressure over BoB
p = 0.019
+0.7 hPa anomaly suppresses convection
JJAS SST difference (El Niño vs La Niña)
El Niño SST during monsoon season indistinguishable from La Niña
p = 0.401
Phases converge by June–July (Fig. 08)
Annual cyclone frequency difference
La Niña (5.29/yr) vs El Niño (4.15/yr) — 27% more storms in La Niña
p = 0.215
High σ (~3–4 storms) masks the signal
SST–Niño3.4 correlation (southern BoB)
Positive correlation (r ≈ 0.15–0.25) — warmer BoB south aligns with El Niño
p < 0.05
Localised south of 12°N only (Fig. 09)

Notable ENSO events and BoB impacts

1982–83

Strong El Niño (+2.0°C): Indian subcontinent experienced severe monsoon deficit. BoB cyclone frequency dropped to near-record lows. Western Pacific and eastern Pacific saw anomalous warming.

1988–89

Strong La Niña (−1.8°C): Anomalously active BoB cyclone season. Record monsoon rainfall over Bangladesh and eastern India. Enhanced moisture flux into the subcontinent.

1997–98

Super El Niño (+2.5°C): Most intense event in the 20th century. Severe Indian drought. BoB SST anomalies among the most negative in the record. Minimal cyclone activity.

2010–11

Strong La Niña (−1.6°C): BoB cyclone season produced multiple landfalling storms on the Indian and Bangladesh coasts. Above-normal monsoon rainfall across the Bay's catchment area.

2015–16

Super El Niño (+2.5°C): Second strongest event recorded. BoB SST stayed below climatology through most of the monsoon. Below-normal BoB storm season confirmed the ENSO suppression mechanism.

07 — Data & Methods

Scientific Basis

This analysis integrates three independent data streams — reanalysis fields, the ENSO observational index, and best-track cyclone data — over a common 1960–2025 period. All methods are reproducible from the open-source Python pipeline.

🌡

ERA5 Reanalysis (ECMWF)

792 monthly fields at 0.25° resolution (1960–2025). Variables: SST, 10m winds (u,v), MSLP, dew point, total precipitation. Domain: 75–95°E, 5–25°N.

📊

ERSSTv5 Niño Index (NOAA)

Monthly Niño 3.4 SST anomaly vs 1991–2020 climatological baseline. El Niño ≥ +0.5°C; La Niña ≤ −0.5°C; Neutral otherwise.

🌀

IBTrACS v04r01 (NOAA)

Best-track cyclone data filtered to North Indian basin (NI). Pre-clipped to BoB shapefile (IHO). 6-hourly positions, storm speed, NATURE category, landfall flag.

📐

Composite Analysis

Phase-based composites relative to 1960–2025 ERA5 climatology. Statistical significance tested using Welch's two-sample t-test (unequal variance, α=0.05).

🔗

Pearson Correlation

Gridded correlation of monthly BoB SST with concurrent Niño3.4 index. Valid grid cells require >20 overlapping months. Significance: two-tailed p < 0.05.

🗺

Storm Phase Classification

Each storm assigned ENSO phase by modal phase across all 6-hourly records. Annual counts aggregated per dominant phase for frequency comparison.

Citation note: All datasets are publicly available. ERA5 via Copernicus Climate Data Store; ERSSTv5 Niño indices via NOAA CPC; IBTrACS via NOAA NCEI. Analysis conducted in Python 3.11 using xarray, geopandas, scipy, matplotlib, and cartopy. Full pipeline available at the GREENS project repository.